
Marketing Reporting: KPIs, Tools and Templates To Consider in 2026
Marketing reporting is essential for any business trying to scale and succeed by better understanding the impact of their marketers’ initiatives and campaign performance. Developing a comprehensive digital marketing report workflow enables you to quickly and easily track progress, measure campaign effectiveness, optimize your SEO strategies and identify areas for improvement.
In essence, having a marketing report readily available for team members and stakeholders is one of the best ways to begin improving your marketing strategy. Without access to in-depth data, your team is effectively operating blindly on instinct without really understanding which tactics work and, more importantly, which ones don’t.
that can help you identify tools and strategies to embrace – and avoid.
This article will take you through the process of identifying relevant goals and KPIs for any marketing team, as well as the marketing tools that can help you identify tools and strategies to embrace – and avoid. You’ll also find marketing report templates, quarterly marketing reports, marketing report examples, and our team’s suggestions on best practices for crafting a digital marketing report that conveys the most critical information to non-marketers.
In this article:
- The basics of a solid digital marketing report
- What are the specific goals of a good marketing report?
- Key Performance Indicators (KPIs) in your marketing reports
- How should I present marketing KPIs in my data reporting?
- Top marketing reporting tools in 2026
- Templates for marketing reports
- Digital marketing reporting and Unito
- When is it time to automate or integrate my reporting?
- Watch us sync GA4 and Google Ads data to Google Sheets

The basics of a solid digital marketing report
Putting together a digital marketing report goes beyond just aggregating marketing data for businesses. It encompasses the process of collecting, analyzing, and presenting data that intertwines marketing with sales, service, and product development. Marketing reports help maintain crucial alignment and synergy between these critical departments.
There are a range of powerful apps and tools designed to help you get the most in-depth, real-time insights into user behaviour that can be shared in a digital marketing report. One of the most popular, of course, is Google Analytics which recently launched its latest iteration, GA4.
If you haven’t yet made the switch from Universal Analytics to GA4, here’s our guide to migrating over to Google Analytics 4.
Here’s how to use marketing reports to track campaigns in GA4
The evolution of marketing reporting
Over the past few decades, marketing reports have undergone a significant transformation, evolving from spreadsheet tabulations to sophisticated, real-time analytics platforms. In the early days, marketers relied heavily on manual data entry and analysis for their marketing reports, often resulting in delays that impacted the agility of their marketing strategies.
The introduction of Google Analytics in 2005 marked a watershed moment for marketing reports, democratizing data analysis and allowing teams of all sizes to track and understand user behavior online. This period also saw the rise of Customer Relationship Management (CRM) systems that helped tailor marketing efforts to individual consumer needs.
In 2015, Harvard Business Review published a study on marketing reporting to quantify its impact. At the time they found that companies were spending 6.7% of their marketing budgets on analytics.
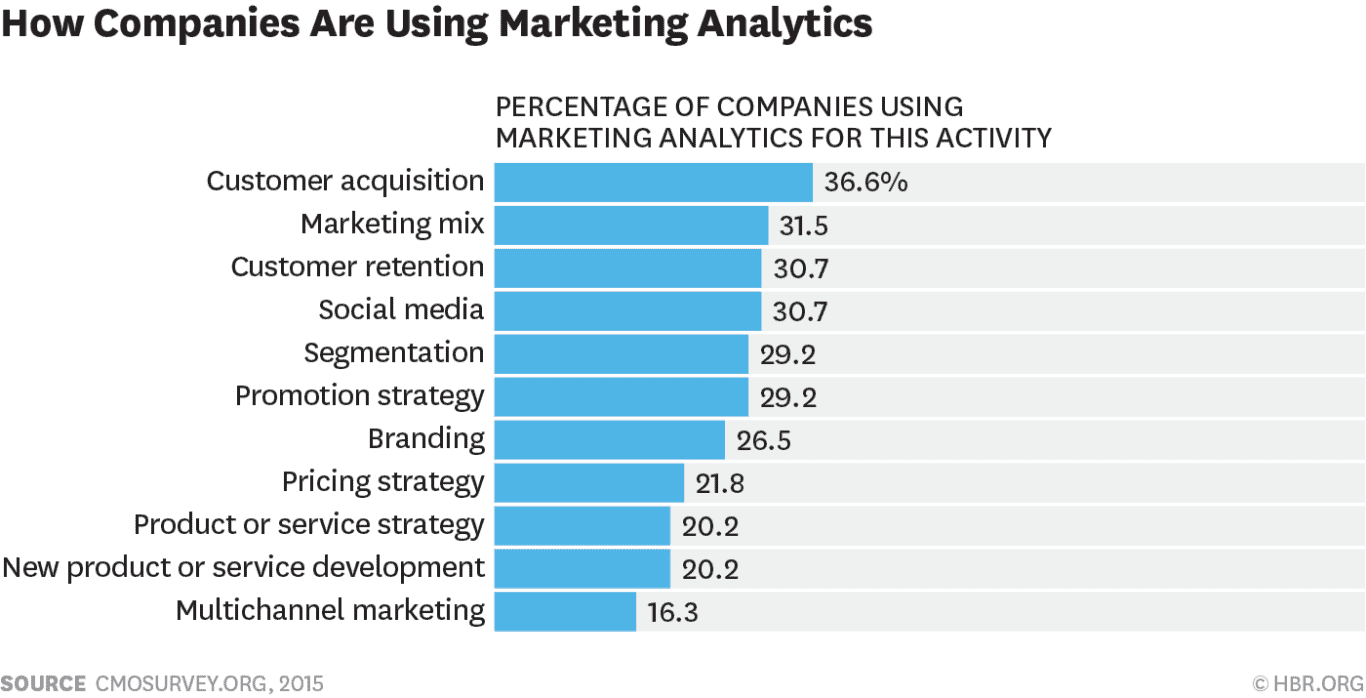
In 2023, Winterberry Group found that the total cost of marketing analytics and data infrastructure in the US, UK and EU exceeded $22 billion USD at the time, estimated to grow beyond $32 billion USD by 2026. Clearly there was a deep need for reliable marketing reports.
Cross-departmental collaboration, insights and initiatives
Today, marketing reporting technology is deeply intertwined with AI, providing real-time data streams, comprehensive dashboards, and the ability to parse huge datasets for granular insights.
This evolution has not only empowered data-driven decision-making, but also paved the way for highly personalized marketing strategies, profoundly shaping the marketing landscape into a dynamic, responsive, and user-centric domain.

Marketing reports simply can’t be viewed in isolation, but must be cross-referenced with insights from other areas and teams, enabling a more comprehensive understanding of business dynamics.
Today, professionals across the business spectrum approach a marketing report with the goal of not just tracking the campaign performance or strategies, but also to understand how these marketing elements interact with and impact other departments.
Unified business intelligence
The objective is to create a unified view in a marketing report that drives more cohesive and effective business strategies, aligning marketing goals with broader company objectives and ensuring every department contributes to and benefits from the insights gathered.
When we talk about putting together a marketing report, we’re referring to the process of collecting, analyzing, and presenting marketing data in a way that is easy to understand and actionable for marketing teams.
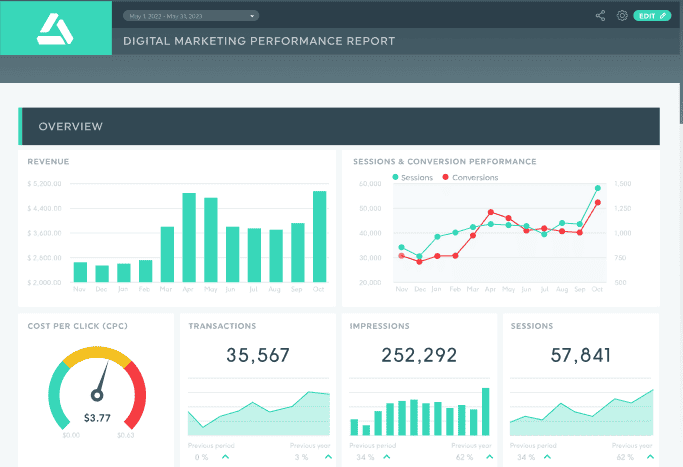
Reports are often delivered or views in comprehensive marketing dashboards can be used to track the performance of individual campaigns, as well as your overall marketing strategy.
Marketing professionals and stakeholders always have a number of key objectives and goals in mind when they begin their journey into marketing reporting. This is true whether you’re the Chief Marketing Officer, a Marketing Director, Data Analyst, Copywriter, SEO Specialist, or another role. The key for any good reporter is to define your goals in advance and those of your manager so everyone’s expectations can be met readily. Here’s a guide to marketing data and analytics for beginners if some of this is new for you.
What are the specific goals of a good marketing report?
Before crafting a marketing report, it’s crucial to have specific, tailored goals that align with your team’s needs. The following goals are designed to be a foundation, which should be refined to fit the unique context of your marketing team.
1. Measure the effectiveness of your marketing campaigns with concrete metrics
Focus on quantifying specific aspects of your campaigns. For instance, break down your analysis into campaign types such as:
- Brand awareness
- Lead generation
- Sales enablement
- Market research
Then track detailed metrics including click-through rates, engagement levels, lead quality, or direct sales conversions to evaluate each campaign’s success accurately.
Reporting on the effectiveness of each marketing campaign (including remarketing efforts) can then be used to identify which strategies or tactics are working well and which ones need to be improved or abandoned.

2. Track progress towards clearly-defined marketing KPIs
Clarify what your objectives actually are in tangible terms. Are you aiming to decrease Customer Acquisition Cost (CAC) or improve Lifetime Value (LTV)?
Set clear targets such as increasing organic website traffic by X%, boosting lead conversion rates by Y%, or achieving a Z% increase in customer retention. Use marketing reporting to monitor these KPIs and adjust strategies accordingly.
If one of your goals is to increase website traffic by 10% over the next quarter, you can use marketing reporting to track that progress and ensure you’re on track to achieve that goal. Web analytics synced to your marketing dashboard can tell you which pages are generating traffic, which ones are underperforming and so much more.
Want to create a custom marketing dashboard?
Here are our guides to setting up your own personalized marketing dashboards in Facebook Insights and GA4.
3. Identify and pinpoint areas for improvement through data-driven analysis
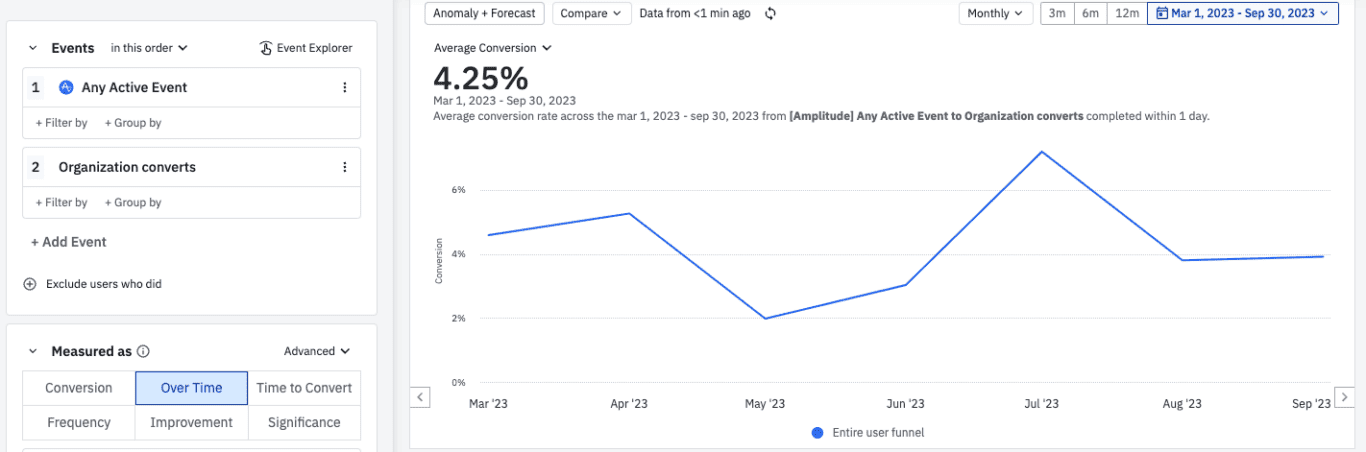
Examine specific operational metrics. For example, if conversion rates are dwindling, look into which particular stages of the sales funnel are underperforming. Use segment-specific data in your marketing reporting to understand the behavior of different customer demographics or product categories. Here’s a guide to setting up your segments in GA4.
Think of marketing reporting as a guardrail in this case, or the canary in the coal mine to warn your team in advance when there are red flags to address.
4. Adjust your roadmap based on data from digital marketing tools
Detailed and data-driven reports can help you to make informed decisions about future marketing efforts and let you know in advance if your roadmap is working as intended.
For example, if lead gen campaigns are outperforming brand awareness campaigns in terms of ROI, consider reallocating budget accordingly. Use data from digital marketing tools to make these decisions, ensuring they’re based on measurable outcomes rather than assumptions.
5. Communicate the value of your marketing efforts to broader stakeholders
Understand the interest levels and knowledge areas of key stakeholders you report to. For instance, present executive metrics including: marketing ROI, cost per acquisition, or the impact on overall revenue growth to the C-suite.
Tailor your reports to focus on broader business outcomes for stakeholders outside the marketing department, using familiar formats such as Google Sheets or Excel for ease of understanding.
By showing executives, investors, or board members how marketing is contributing to the company’s bottom line, you can build support for your initiatives and secure the budget you need to be successful.
Key Performance Indicators (KPIs) in your marketing reports
KPIs are specific metrics derived from your marketing reports. You’ll use KPIs to make decisions and adjustments – where to focus more of your marketing efforts, how to adjust your sales leads, what kind of social media channels to spend money on, and much more.

What are some typical KPIs for marketers?
Awareness metrics (also referred to as vanity metrics)
This refers to the traffic, or number of visitors to your website. It can be broken down into organic traffic, unique visitors, referrals (which websites are sending people your way?), and direct traffic (visitors who simply type your URL into their browser).
- Number of unique visitors
- Page views
- Bounce rate
- Average session duration
Conversion rate
This KPI can have varying definitions depending on how you structure your marketing funnel. Typically it refers to the percentage of visitors who take a desired action on your website: signing up, making a purchase, submitting a form, etc.
Customer Acquisition Cost (CAC)
This is the total cost of acquiring new customers, with consideration for marketing and sales expenses.
Customer Lifetime Value (CLV)
This measurement calculates the revenue your business can expect from a single account or customer. Read more about customer lifetime value.
Social Media Engagement
Think clicks, shares, comments, retweets, followers, etc. This is a metric covering all visitor interactions with your organization across social media platforms. Here’s a list of 10 customer engagement metrics you should be measuring.

Email Open and Click-Through Rates
A measurement of how many recipients open emails you send them and how many then click on a link within.
Click-through rate is a percentage used to determine how many visitors click on a piece of marketing content after seeing it. Here’s how it’s calculated: Number of clicks ÷ impressions = CTR
Return on Investment (ROI)
How profitable are investments in your digital marketing campaigns? How is your paid advertising strategy working out? Is your blog traffic converting or not?
This is a calculation of campaign performance and the impact of marketing strategy at large, so that senior leadership can have a sense of your team’s value to the company.Here’s how to turn insights into ROI with Google Analytics.
ROI can best be reviewed and shared through monthly reports on campaign performance. Monthly marketing reports give a clear indication of marketing metrics over a sustained period of time without as much volatility or fluctuation. You’ll find more on that below, including a monthly marketing report template that you might find useful.
Bounce Rate
This is the percentage of visitors who leave your site after only viewing one page. As a content marketer, try to keep this as low as possible. Tools such as Google Analytics can provide this information in just a few clicks.

Lead generation
Lead generation often goes hand-in-hand with paid advertising and targeted marketing efforts. It’s the process of capturing and nurturing interest through your organization’s sales funnel. Typical KPIs include:
- Number of leads generated
- Cost per lead
- Lead-to-customer conversion rate
- Marketing qualified leads (MQLs)
- Sales qualified leads (SQLs)
Sales
- Forecast management
- Pipeline management
- Deal management
Brand awareness
- Social media followers
- Website traffic from organic search
- Net promoter score (NPS)
Return on investment (ROI)
- Marketing ROI
- Customer acquisition cost (CAC)
- Customer lifetime value (LTV)
How should I present marketing KPIs in my data reporting?
It’s important to note that not all of the KPIs listed in this article are relevant to marketers in any industry, and there are certainly more KPIs to consider than we’ve mentioned so far. As long as you have detailed marketing reporting templates to choose from, you’ll be able to easily share details on performance metrics in monthly reports.
The goal when choosing and presenting key performance indicators is to provide your team with actionable insights through a marketing report that highlights successes and failures through detailed marketing metrics.
But this is a good place to start thinking about KPIs for your next marketing campaign, and setting a standard for these reports. We recommend choosing the KPIs that are most important to your organization’s specific marketing objectives and help assess campaign performance.
KPIs can be used to measure the performance of a variety of marketing and PR campaigns and channels, including:
- Content marketing
- Search engine optimization (SEO)
- Pay-per-click (PPC) advertising
- Social media marketing
- Email marketing
- Event marketing
By tracking these KPIs over time, marketers can identify which marketing or PR campaigns and strategies are working well and which ones need to be improved. This information can then be used to make informed decisions about future marketing efforts.
Monthly marketing reports
Pros of a monthly marketing report
- A monthly digital marketing report offers a comprehensive view of key metrics related to your target audience over the long term. Your monthly report is a better indicator of sustained marketing success and efforts, advertising campaigns, and marketing activities.
- Tracking marketing channels and marketing performance month-to-month allows for a more strategic analysis of trends, patterns, and overall marketing performance. This broader perspective is particularly beneficial in B2B digital marketing, with longer cycles for your sales team and decisions often being made at a higher level.
- By analyzing this report as opposed to a general marketing report, your team can identify what’s working and what’s not, facilitating more informed decisions regarding your marketing budget.
Cons of a monthly marketing report
- There is a delay in identifying and responding to issues or opportunities in your primary marketing channels. A month can be a long time in the lifespan of marketing campaigns and digital marketing efforts.
- Waiting for all the data to come in through monthly marketing reports can result in missed opportunities to optimize advertising campaigns, and address actionable insights related to your target audience.
- The lag related to monthly reporting can lead to inefficiencies in a global marketing strategy and you’ll be slower to inform future marketing decisions and marketing spend.
Weekly marketing reports
Pros of a weekly marketing report
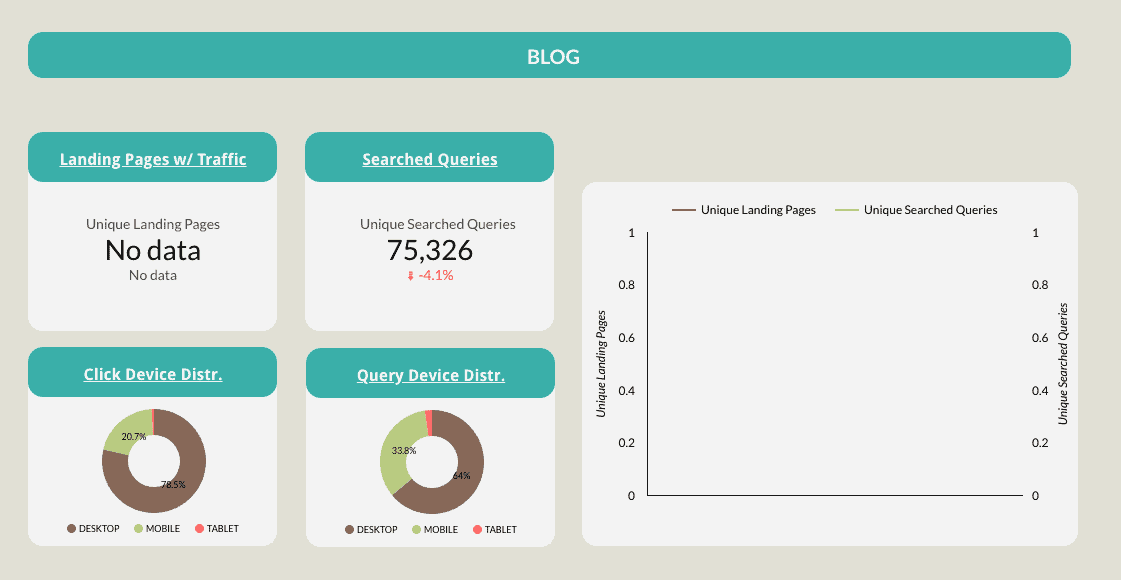
- Weekly marketing reports on blog traffic, website traffic metrics, paid advertising, performance metrics, provide more immediate feedback on the performance of marketing activities and your marketing department’s performance. This is key to enabling quicker reactions to trends and anomalies spotted in your ppc marketing report, web analytics report, social media report and other relevant data.
- When it comes to digital marketing, it’s important to closely observe changes in those relevant metrics so you can always fine-tune your content marketing efforts, or social media marketing strategy. Your competitors are always going to pay attention to the same primary marketing channels as you and their own campaign performance. If you suddenly gain or lose critical keywords, for example, a good digital marketing report will show that so you can respond quickly.
- Your search engine optimization efforts and engagement across social media platforms depends on fast response times to encourage the best possible engagement and conversion rates. Frequent reporting on key metrics and marketing activities can also foster a culture of agility and continuous improvement within a marketing team, as it encourages regular reflection and adjustment.
Cons of a weekly marketing report
- On the downside, weekly reports can lead to a short-term focus, potentially sacrificing long-term strategy for immediate results. While daily marketing reports might be too volatile, weekly digital marketing reports are only slightly less so. It takes time to nurture leads and build relationships with potential buyers, so your marketing team needs to pay attention to their key performance indicators rather than pursue quick wins.
- The increased frequency of these reports can also lead to information overload and drawing inaccurate conclusions. While it’s important to understand your team’s marketing performance and marketing metrics, you also don’t want to make it harder to distinguish between meaningful digital marketing trends and normal week-to-week fluctuations.
- Otherwise, you risk your team taking reactionary steps that aren’t always necessary or vital to your marketing campaigns. This can result in unnecessary changes to campaigns and strategies.
Some of the top digital marketing reporting tools in 2025
There are a wide range of tools digital marketing teams use in their day-to-day for market reporting, social media analytics and more. Here are just several recommendations to help you get a sense of what’s out there from free marketing reporting tools to extensive, enterprise-level resources. Here’s a more comprehensive guide to the best apps and tools for marketing reporting.
Find a tool that best suits your marketing budget and the level of digital marketing reporting detail that you need. It can be overwhelming to manage all the data that’s available, so keep this in mind and don’t go overboard!
1. Google Analytics
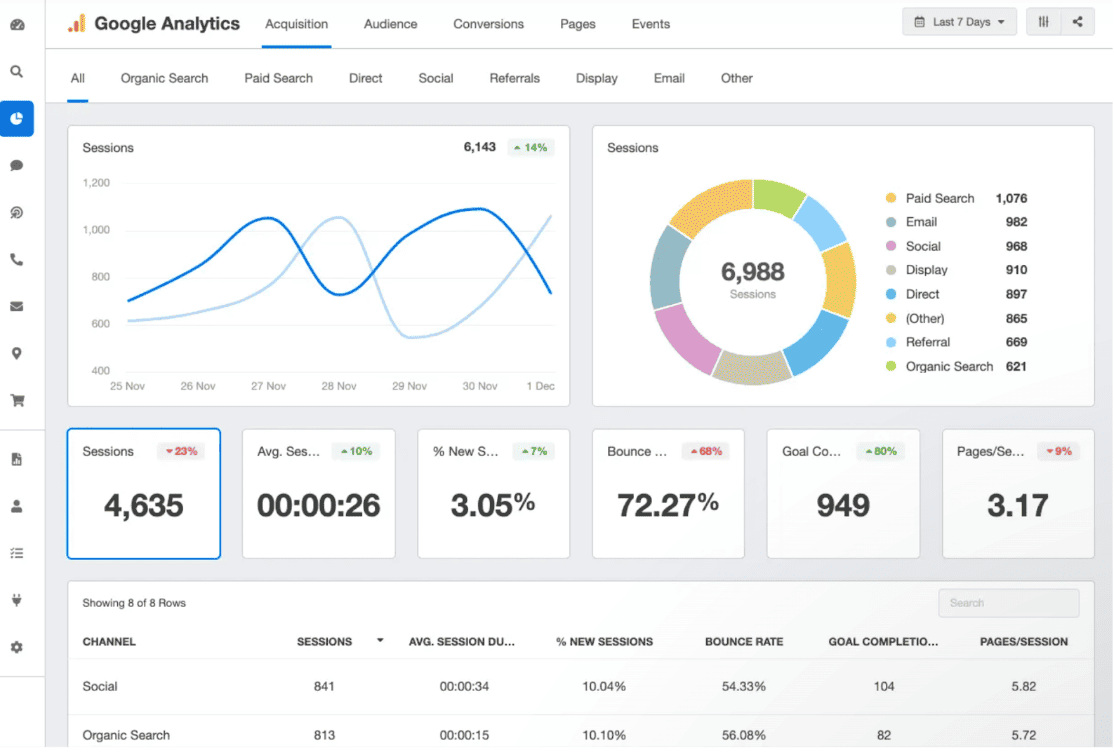
This popular web analytics service tracks and reports on user behavior and website traffic. It is one of the most popular marketing reporting tools available with a wide range of features, including:
- Website traffic analysis
- Goal tracking
- Funnel analysis
- Cohort analysis
- Ecommerce tracking
- Custom reporting
Here’s all you need to know to set up an effective marketing dashboard in GA4.
2. Looker Data Studio
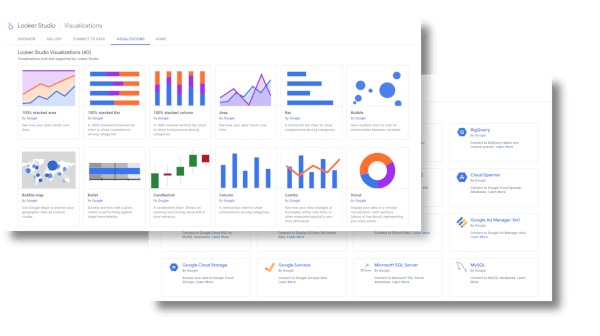
This free data visualization tool, formerly Google Data Studio, allows you to create custom marketing dashboards and reports. It integrates with a variety of data sources, including Google Analytics, Google Ads, and Google Search Console.
3. Databox
Here’s a paid marketing reporting tool that offers a variety of features, including:
- Customizable dashboards
- Automated reporting
- Real-time data updates
- Team collaboration
- Integrations with over 70 marketing data sources
4. AgencyAnalytics
AgencyAnalytics is a paid marketing reporting tool that is specifically designed for marketing agencies. It offers a variety of features, including:
- White-labeled reports
- Client management tools
- Proposal generation
- Competitive benchmarking
- Integrations with over 50 marketing data sources
5. Whatagraph
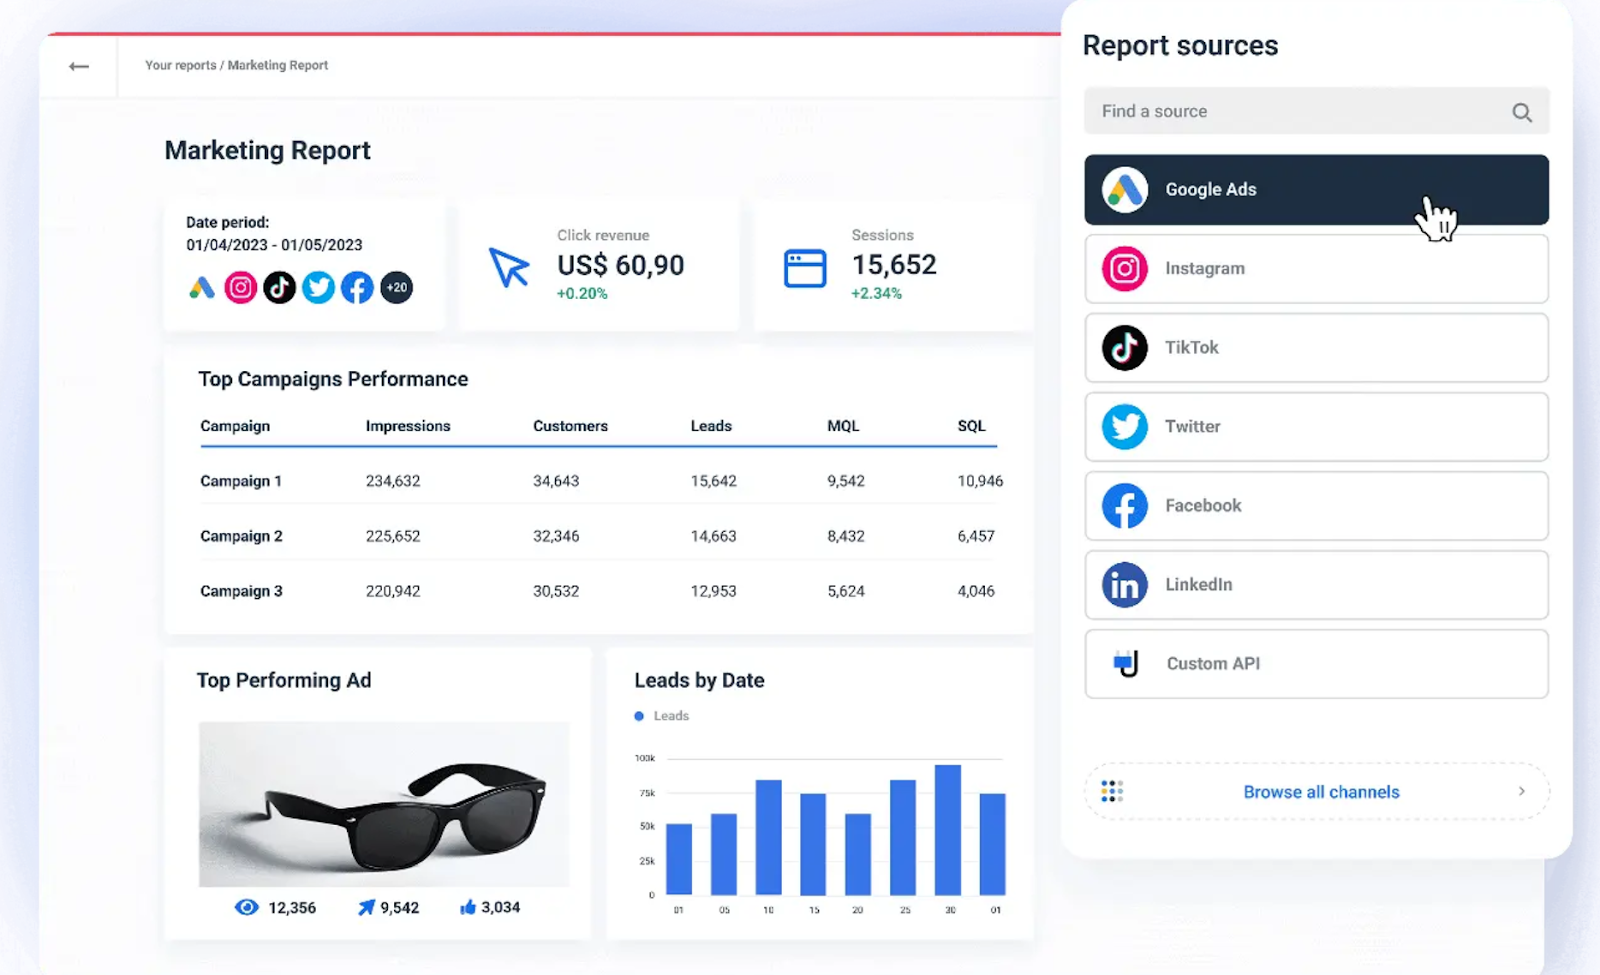
If you’re looking for a paid marketing reporting tool that’s easy to use and offers a variety of features, you could consider Whatagraph. Features include:
- Customizable dashboards
- Automated reporting
- Pre-built digital marketing report template
- Team collaboration
- Integrations with over 40 marketing data sources
Digital marketing report templates to get you started
While there are dozens – ok hundreds! – of options to create digital marketing reports with templates to get you started, here are 10 we’ve chosen that cover a number of the key performance indicators that we mentioned above:
- Improvado: Marketing dashboard template
- HubSpot: Marketing automation report templates for Excel, PowerPoint, and Google Drive
- Agency Analytics: Email marketing report template
- Slide Team: Email campaign reporting templates
- Mailchimp: Email marketing performance report template
- Hootsuite: Social media marketing report template
- Unito: Monthly reporting templates
- Unito: 5 Free SEO reporting templates
- Sprout Social: Social media analytics report template
- Later.com: Instagram marketing report template
- Facebook: Meta ads marketing report template
- Ahrefs: SEO report template

Digital marketing reporting and Unito
By now you know that digital marketing reporting is an important part of any marketing strategy and tracking campaign performance. By using the highly effective and informative tools and apps available today, you can take your organization to the next level. Here’s a quick summary of the main benefits of marketing reporting:
Understand your buyers and customers
This information can help you create more targeted and effective marketing campaigns in tools such as Facebook Insights or Google Analytics.
Prove the value of your marketing efforts
Marketing reports can help you demonstrate the ROI of your marketing investments to senior management and stakeholders. This can help you secure more funding for your marketing initiatives.
Choose a timeframe that suits your needs
How do you plan on tracking digital marketing performance? With a social media marketing report? A daily marketing report? What does a typical marketing report look like to your analyst? Some teams prefer quarterly marketing reports to allow as much time as possible to elapse in order to have a longer timeframe to review.
Keep in mind, these are just a few of the advantages. By using Unito to improve project reporting, team collaboration, accountability, and efficiency by connecting projects across different work management tools, you can extend your results even more.
When is it time to automate or integrate my reporting?
If you’re thinking about automating or integrating your reports, make sure you have a workflow you’re happy with in each tool, first. Then it’s time to decide where you want to sync (or export) your data, and how you want each tool to interact with another. It also depends on your industry and how familiar your colleagues are with the various automation and integration options out there. Here’s a guide to SaaS reporting essentials for our colleagues in the tech industry.
That’s where an iPaaS solution such as Unito Sync Platform can help you get started. Here’s our ultimate guide to automated reporting to give you a sense of how Unito can optimize your reporting workflows. Unito now supports a number of popular marketing analytics tools including Google Ads, GA4, Facebook Ads Manager and more.
Watch how easily Unito syncs data from GA4 Google Ads, or Facebook Ads Manager to Google Sheets
Follow along with our step-by-step GA4 integration guide or watch one of these videos:
Sync GA4 Data to Google Sheets
Sync Google Ads Data to Google Sheets
Sync Facebook Ads Manager to Google Sheets
Here’s a step-by-step guide to syncing Facebook ads data or you can watch below:
Want to see how Unito transforms marketing reporting?
Get in touch with Unito product experts to see how the right integration can completely change the way your marketing team reports on its success.
Marketing reporting FAQs
What is marketing reporting?
The term “marketing reporting” covers any instance where your marketing team uses a report — or some other form of communication — to share how their efforts have impacted the overall organization. They may track KPIs for a specific campaign and share these regularly as the campaign goes on. They may be expected to complete a monthly report that keeps important stakeholders informed about essential initiatives. They might also use reports internally, so marketing managers know what their teams are working on.
What reports are used in marketing?
Many different kinds of reports are used in marketing, from marketing-specific reports to more general reports you’d find in any department. A few examples of marketing-specific reports include:
- SEO marketing reports
- Weekly and monthly marketing reports
- Marketing campaign progress report
- PPC marketing report
- Social media marketing report
- Ecommerce marketing report
- Reports on website traffic and conversions
Marketers will also use more generic reports that any other teams use, such as:
- Project progress reports
- Risk reports
- Time-tracking reports
- Resource management reports
- Variance reports
- Project health reports
How do you report on marketing metrics?
While the exact process for building each type of marketing report will vary, they all follow these broad steps:
- Understanding requirements.
- Collecting the necessary data.
- Turning raw data into insightful information and metrics.
- Formatting data into a report that’s easy to read (usually with dedicated tools or templates).
- Revise your report.
- Share the report with the relevant stakeholders.