The Best Examples of Marketing Reports and KPIs in 2026
Creativity is the heart of great marketing. But today, marketers have access to a wealth of data that can make their work as impactful as it is inspired. Marketing reporting is the path to understanding that data; it’s your roadmap in the digital marketing world.
Comprehensive reports let marketers see how their audience reacts to content in real-time. Having access to live data from marketing reports then enables teams to fine-tune content initiatives and strategies in real-time to get better results.
Reporting means you’re not just throwing your time, energy, and creativity into the void. Done right, reporting is the key to effective, data-driven marketing. And great marketing reporting is within reach for all marketers.
You just need the right tools, broad goals, and tactical KPIs to measure progress towards them to support your marketing funnel.
What is a marketing report?
A marketing report is a document that presents your marketing activity data in a clear, comprehensible manner. It often includes visual elements like charts and graphs and is usually generated using specialized software tools.
At its core, reporting in this context involves gathering and interpreting data about your marketing activities. Any good marketing report needs to answers critical business questions such as: Are your marketing efforts effective? Are they helping you achieve your goals?
Every click and interaction is a piece of valuable data, offering insights into audience behavior and campaign effectiveness.
How does data collection factor in to marketing reporting?
There are several key steps involved in assembling data for marketing reports. Here’s a breakdown of each step from data collection to strategic adjustments:

- Data Collection: Gather data from various marketing channels (like social media, website analytics, email campaigns, etc.).
- Data Aggregation: Compile data in a centralized system for analysis. This may involve using tools like CRM systems or marketing analytics platforms.
- Data Cleaning and Processing: Cleanse the data for accuracy, removing duplicates and correcting errors. Then process it to a usable format.
- Data Analysis: Analyze the data to identify trends, patterns, and insights. Use statistical methods and analytics tools.
- Insight Generation: Interpret the data analysis to generate actionable insights. What does the data tell you about customer behavior, campaign performance, etc.?
- Strategy Development: Develop marketing strategies based on the insights. This might include targeting specific customer segments, adjusting campaign messages, or reallocating budgets.
- Implementation: Implement the new strategies in your marketing campaigns.
- Monitor and Adjust: Continuously monitor the results of the new strategies. Adjust the approach as needed based on ongoing data collection and analysis.
- Feedback Loop: Create a feedback loop where the results of the monitoring phase feed back into the data collection phase for continuous improvement.
Key considerations for any digital marketing report
Marketing reports often use visualizations like charts and graphs to share data on your marketing activities in a way that’s clear and easy to understand. They’re typically generated by specialized tools, or at least contain information that was — below, we’ll share a list of some important software tools for marketing reporting.
What should digital marketers consider in their reports?
Reporting is especially huge for digital marketers, since every interaction between your audience and your brand is captured in data. Marketers don’t have to wonder how many people their content has reached, or what kind of actions they took after seeing it.
Digital marketing reporting gives them those numbers, which means they can constantly adjust their strategy to improve them. There are even AI marketing tools that can help you improve your strategy.
How should marketing reports be used?
Reports can be used strategically to make big decisions and assess if your approach is aligned with greater goals. But they’re also useful for reporting on routine work and making sure your team isn’t getting overwhelmed while focusing on initiatives that
Usually, marketing reports are used to help leaders understand how the team’s expenses, decisions, and efforts are paying off. They might be shared with the marketing director or manager, or with people outside of the marketing team entirely.
Do you need help aligning your marketing and IT teams on common business goals?
Our team interviewed nearly two dozen senior executives from organizations including LinkedIn, Salesforce, Meta, HubSpot, and many more. Get their insights, advice, and best practices on how to align departments on shared business goals in our free eBook.

8 top examples of marketing reports
Here are the marketing reports you’re most likely to encounter in your daily work.
Marketing overview report
Share key results and outcomes from all your marketing channels. Best compiled on an annual or quarterly basis. This template is for GA4.

Marketing campaign report
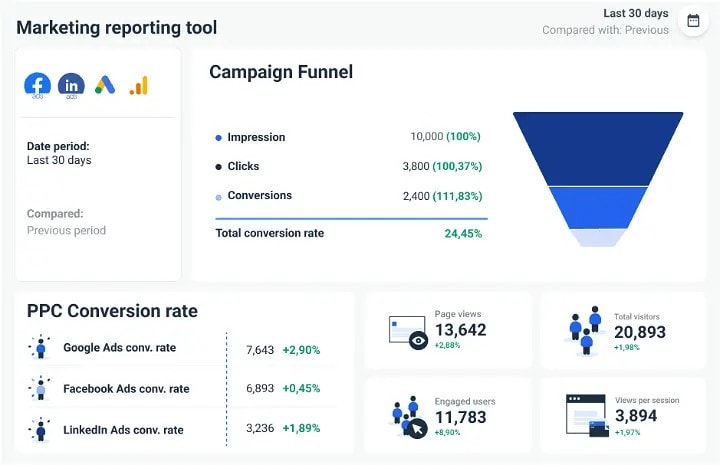
Report on the results of a campaign that spanned multiple channels, like social media, email, paid ads, and even events. Here’s an example from LinkedIn:

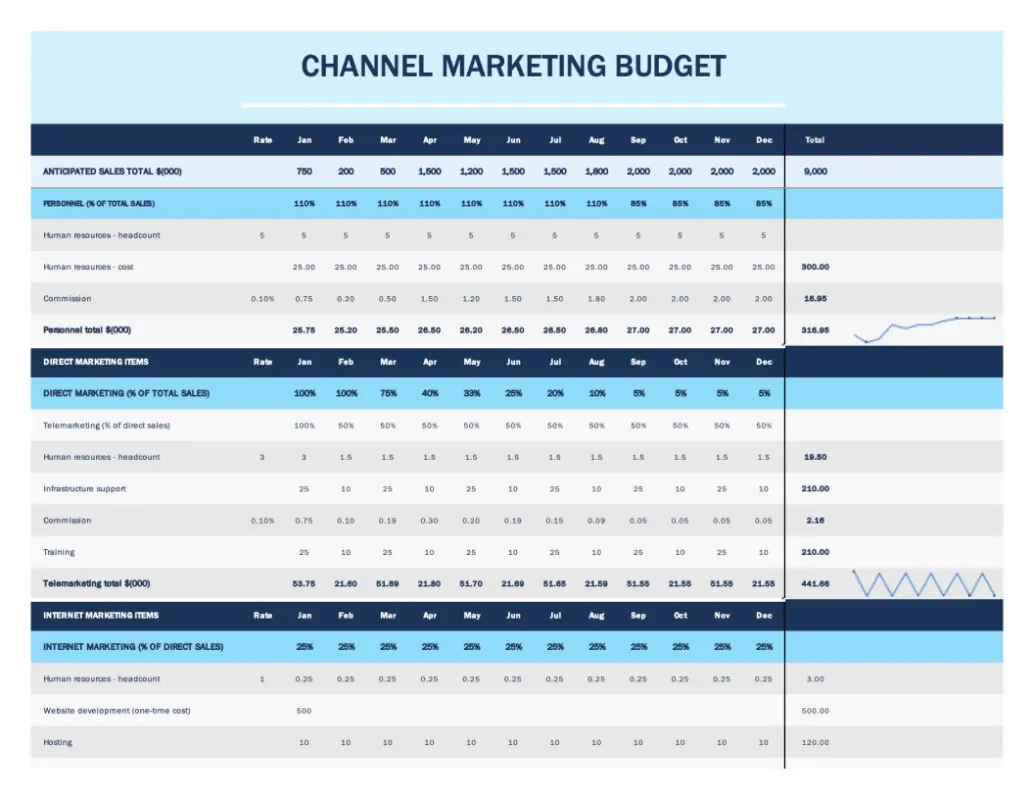
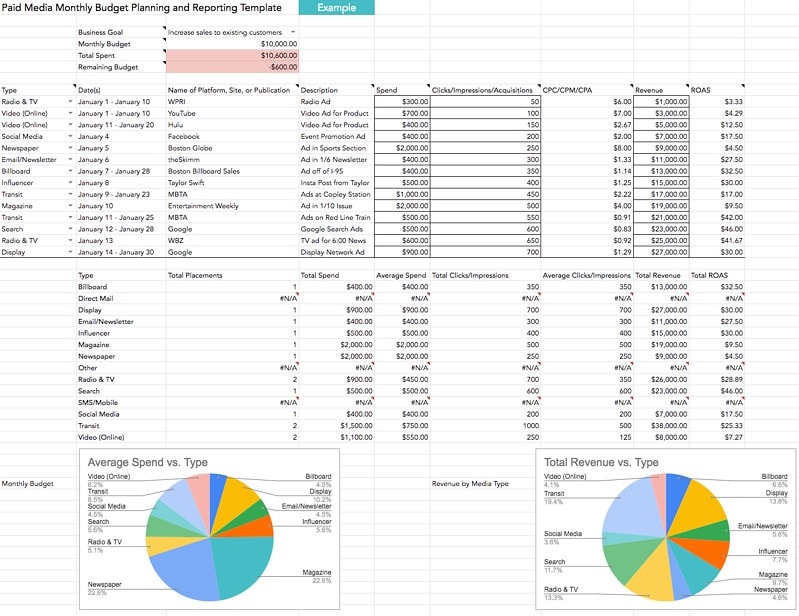
Channel marketing budget report
A report detailing anticipated sales month over month (MOM). Source: (Excel)
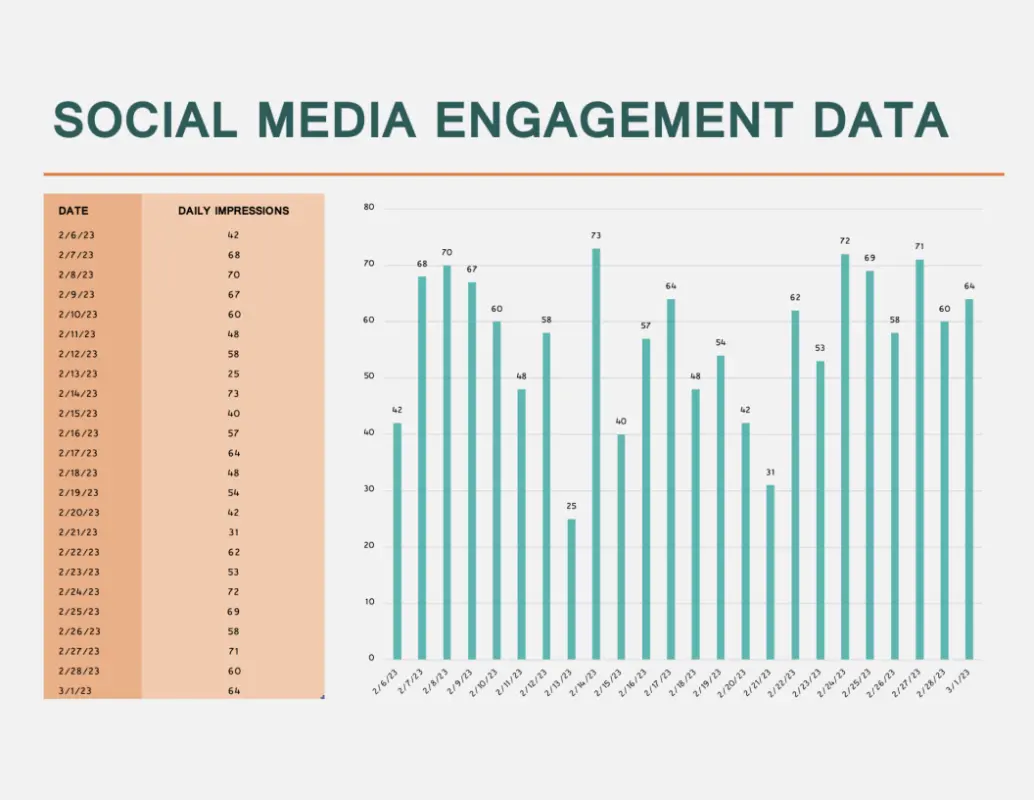
Social media engagement report
Report your social media channels’ performance. Usually compiled monthly to review and adjust strategy. Source: (Excel)
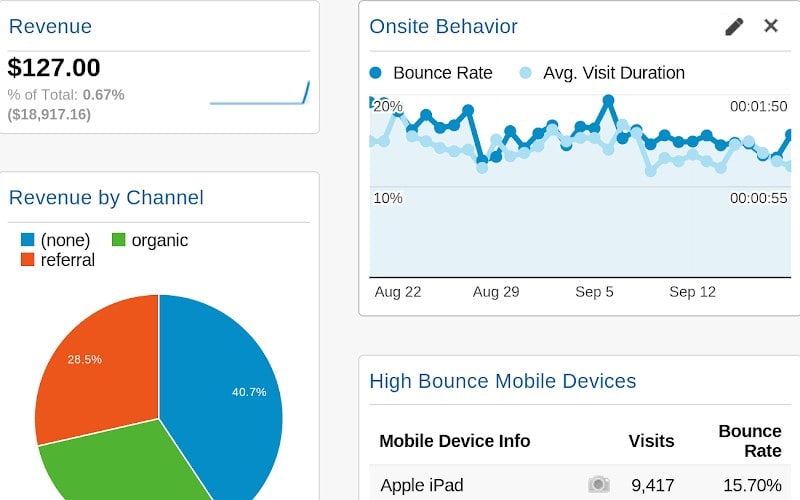
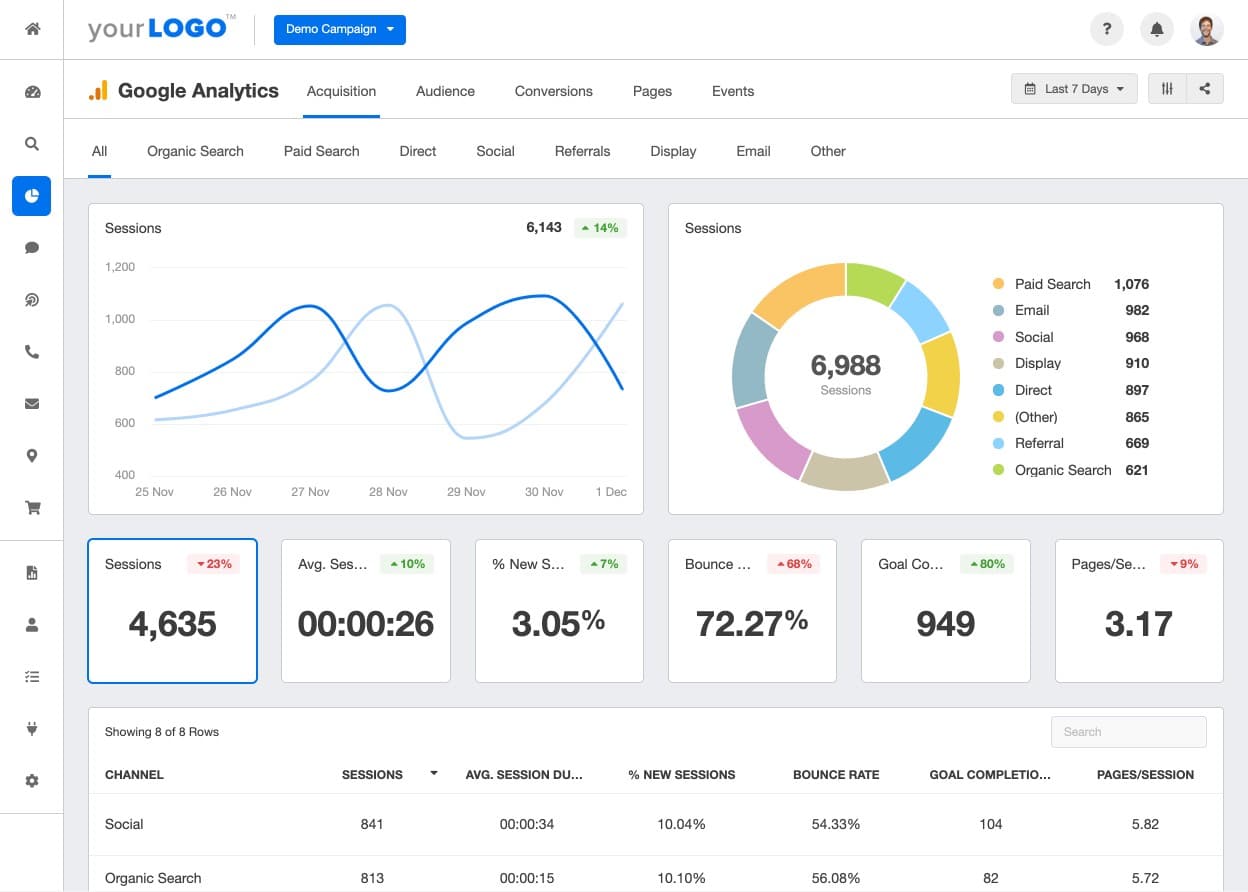
Google Analytics reports
Google Analytics tracks the behavior of visitors to your website, including metrics like bounce rate, acquisition, and conversions. Here’s how to get started with the New Google Analytics User Starter Bundle.
Paid ads marketing report
Track the ROI of your paid search or social media ads, using metrics like click-through rate (CTR) and conversions. Here’s a Google Sheets template, courtesy of HubSpot.
Email marketing report
How are subscribers reacting and responding to your marketing emails? How often are they getting opened, or deleted? Are subscribers clicking on the content, and deciding to buy? HubSpot makes this process easy for their users with built-in analytics tools. Here’s how to analyze your marketing email campaign performance in HubSpot.

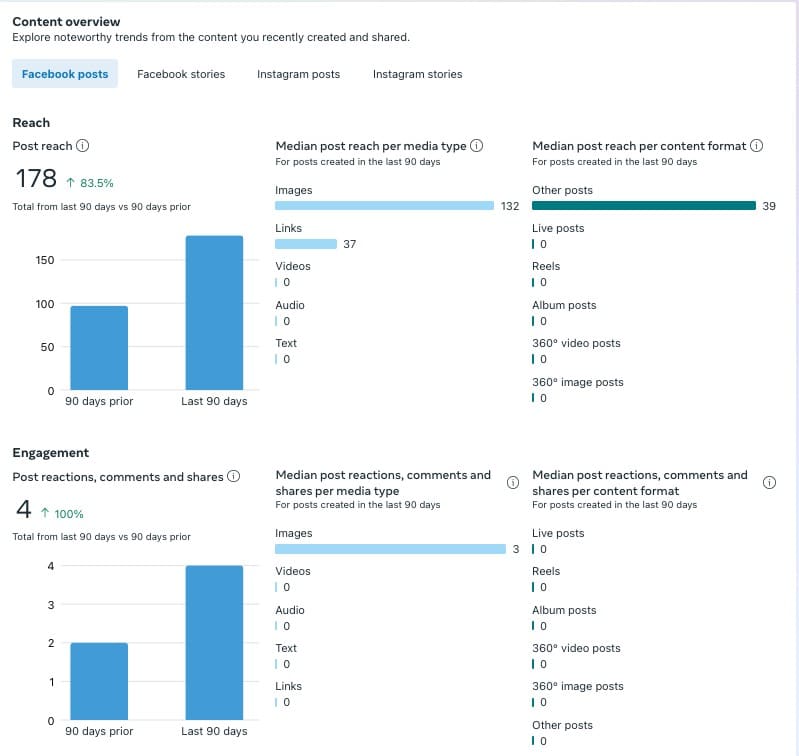
Facebook Insights reports
Facebook Audience Insights enables you to review audience information, as well as the impact and reach of your content, as well as set goals for yourself. Here’s a guide to getting started with marketing reports in Facebook Insights.
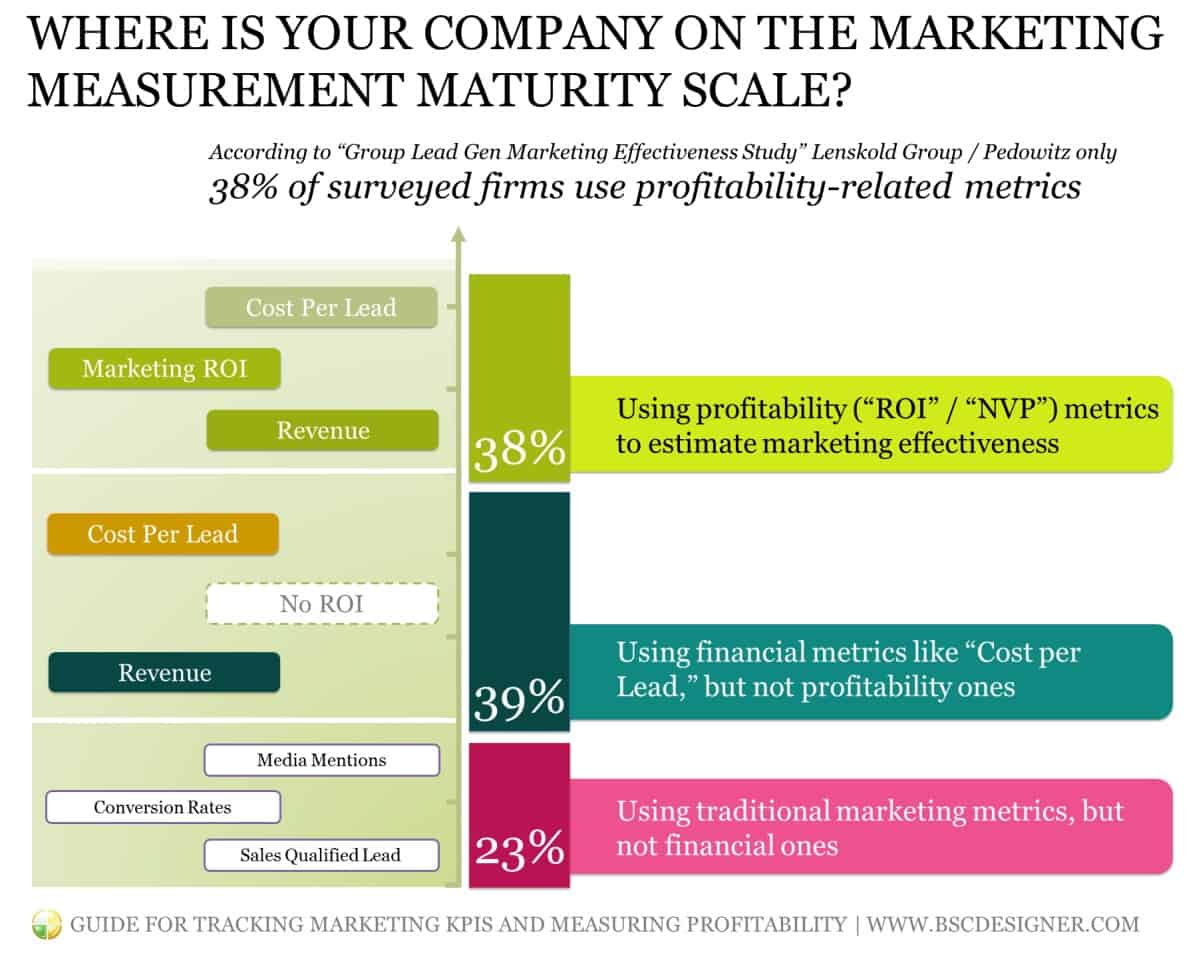
KPIs and marketing reporting
Key performance indicators (KPIs) are measurable outcomes that marketers use to track progress toward their goals. They make broad objectives more specific and quantifiable. If your general goal is “grow our audience,” you might choose a KPI like “gain 100 newsletter signups a month.”
KPIs are an important part of marketing reporting because they keep your information focused on strategic goals. They give marketers a way to assess their results — is 70 new newsletter signups good, or merely acceptable?
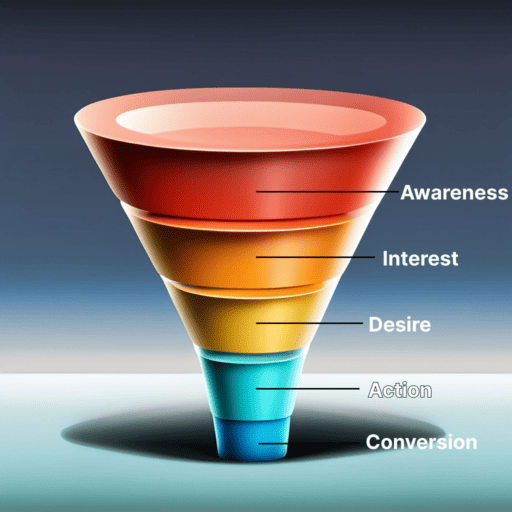
Metrics and KPIs are valuable at every stage of the marketing funnel. Early in the customer journey, you might track the reach and impressions of your social media posts. Mid-funnel, KPIs like email signups or website visits might be useful. At the bottom of your marketing funnel, you’d look at metrics like conversation rate and total sales.
Top 6 KPIs for marketing reporting
Across channels and throughout the customer journey, KPIs help marketers make good decisions and work in a data-driven way.
Here are a few of the most important KPIs to include in marketing reports. Get more details in this guide to essential marketing metrics.
- Return on investment (ROI): Calculates how much profit a company’s marketing efforts are generating. It divides the total cost of a marketing activity (or all activities) by the total revenue they generated.
- Conversion rate: Measures the proportion of people a marketing campaign reached, that actually turned into customers.
- Click-through rate (CTR): CTR tracks how many people actually clicked on a link within some kind of digital advertisement, like a marketing email or paid social ad.
- Bounce rate: How many people visited your website, but navigated away after viewing only one page? A very high bounce rate could indicate your website isn’t engaging enough or is confusing to navigate.
- Engagement rate: A social media KPI that measures how many people saw a piece of content, vs. how many actually interacted with it by liking, sharing, or commenting
- Cost per click (CPC): A crucial metric for paid ads, this metric divides your total ad spend by how many viewers actually clicked on the content.
6 top marketing reporting tools
Digital marketing generates massive amounts of data—humans can’t make sense of it without a little technology help. Luckily, software tools turn marketing data into clear, concise reports and analytics that help marketers reach their goals.
Google Analytics
For reporting on website traffic and website visitor behavior. As long as your domain is registered with Google, you have access to these stats.
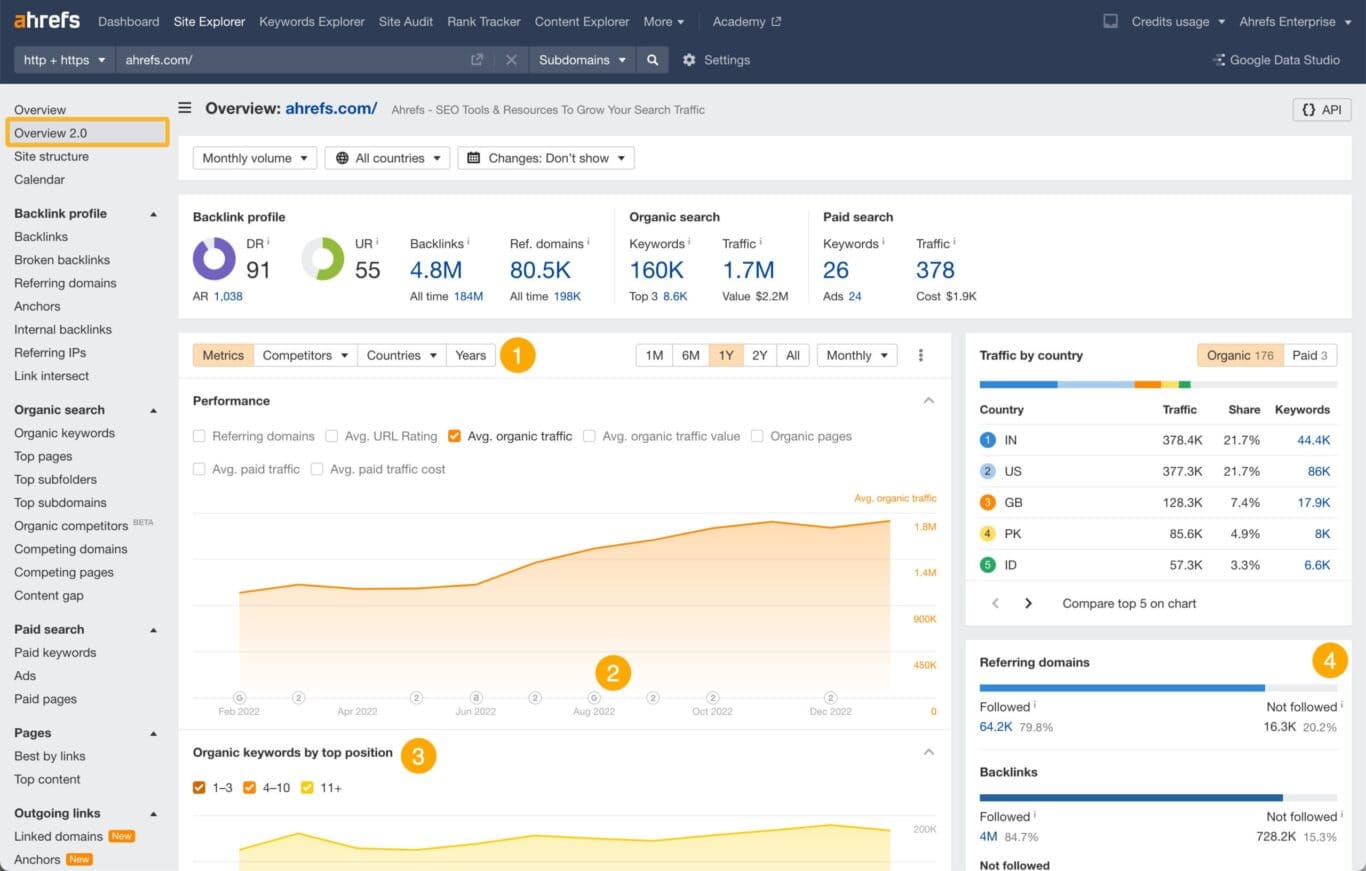
An SEO tool like Ahrefs, SEMrush, or Moz
These tools allow marketers to research keywords, compare their content to the competition, and optimize SEO marketing efforts. But they’re also great for content marketing reporting.
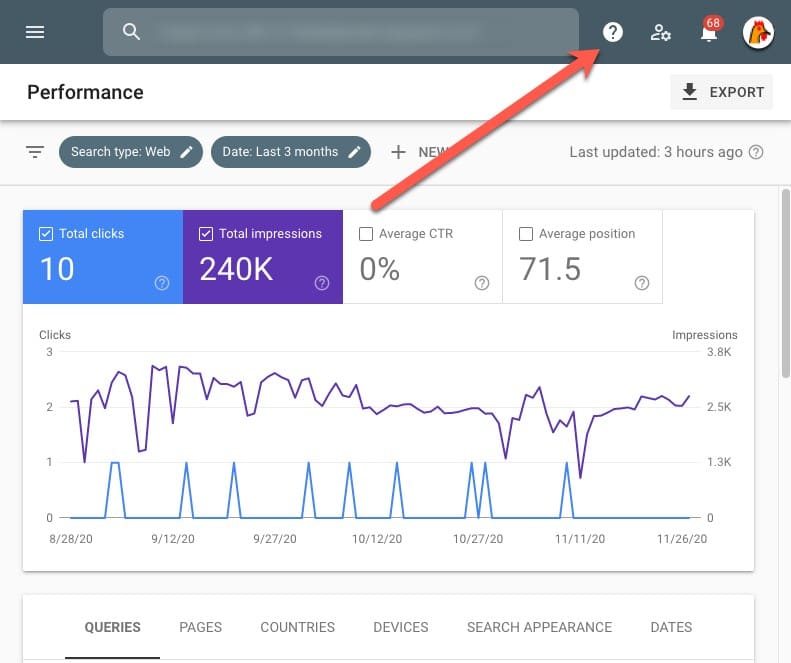
Google Search Console
Working off of Google data, this platform is great for reporting on keyword ranking in SEO content marketing efforts.
Social media native reporting
All social media tools offer some native analytics that can be used in marketing reports. This is especially useful if social media advertising or community-building are a big part of your strategy.
Social media reporting tools
If you need more advanced social media reporting, try a dedicated tool like Hootsuite or Buffer. Not only do they help streamline your social media marketing efforts, they also have great reports to help you make better decisions.

Customer relationship management (CRM) tools
These all-in-one systems, like HubSpot, Salesforce, and Zoho CRM track many kinds of customer data. They’re full of information that’s valuable for marketers.
Marketing Reporting is for everyone
Marketing reporting makes data-driven, results-oriented strategy accessible to all marketers.
Whatever your budget, industry, and goals, there’s no limit to what you can achieve with the right marketing reporting tools and KPIs.
Think of this as your secret sauce—the hard data that will help you get to know your customers, and take your creativity to new heights.