
Marketing Data Visualization Tools: Trends You Can’t Ignore in 2026
Your 2026 marketing strategy will either ride the wave of data visualization or be pulled under by the current. In this case, the current is the tsunami of information your marketing team has access to that needs to be represented in a way non-marketers can easily understand.
After all, data visualization for marketing isn’t just about translating key information into stylish bar graphs or pie charts. It’s more about finding the right apps to help you turn raw data into valuable insights that your team can act on.
That’s the key to powerful data visualization: using it to help stakeholders and other decision-makers see your point of view quickly and easily. After all, we live in an age where everyone’s time and attention is precious and there isn’t always space to think about someone else’s lines of spreadsheet data and what it could mean.
Great data visualizations should always tell a story
Effective marketing reporting must incorporate some aspects of the art of storytelling in order for it to make a difference.
So with that in mind, let’s dive in with a closer look at the marketing data visualization tools that had the greatest impact in 2025. We’ll talk about what’s relevant, which tools to consider in 2025, and why you need to keep pace.
Unveiling the Top Marketing Data Visualization Tools for 2026
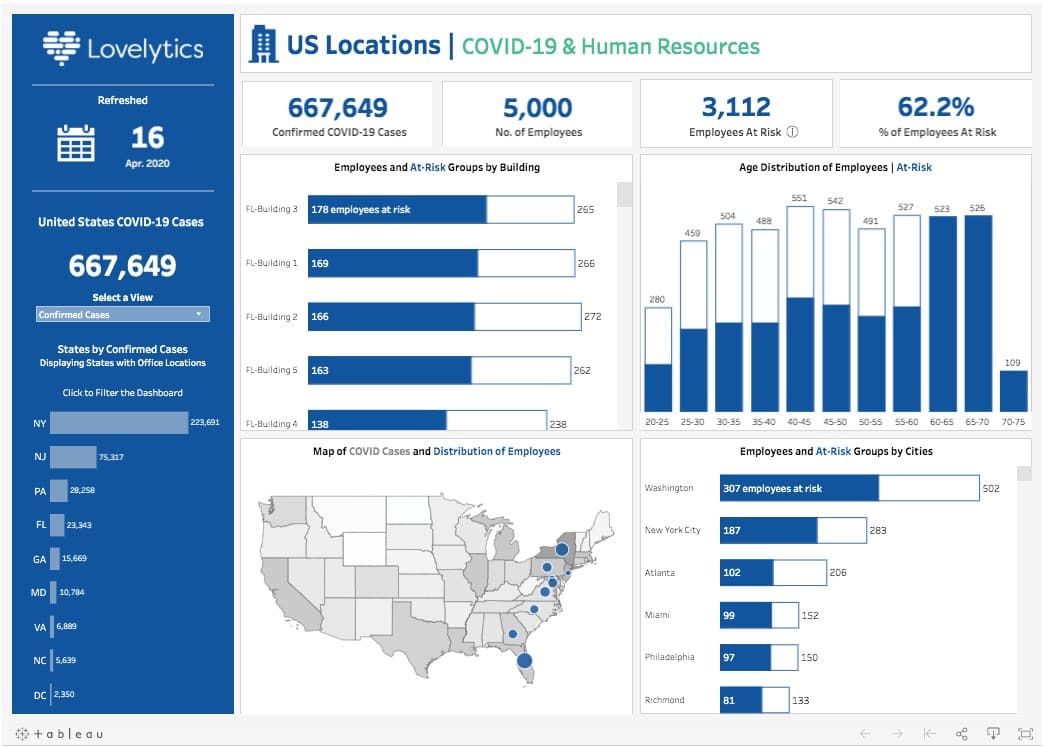
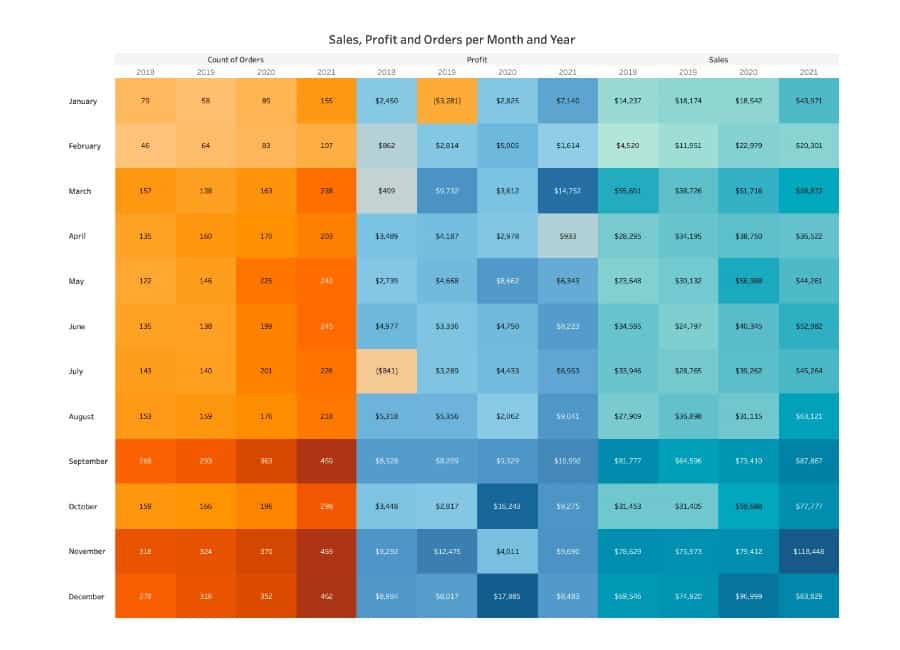
Tableau
Tableau has been a premier tool for data visualization since its founding in 2003, beginning as a computer science project at Stanford University. It excels in enabling users to create interactive and shareable dashboards, which highlight trends, variations, and density of data in the form of graphs and charts.
Tableau’s strength lies in its ability to connect to a vast array of sources for data integration, from simple spreadsheets to complex databases, without the need for extensive technical skills. This versatility, combined with its intuitive user interface, makes it a popular choice for businesses looking to transform raw data into insightful, actionable information efficiently.
Here’s what G2 reviewers like about Tableau
- Data Interaction and Insights: Tableau has transformed how users interact with, and gain insights from data, making it a standout analytics tool.
- Ease of Use: Tableau’s straightforward design makes it accessible for both professionals and beginners, irrespective of technical expertise.
- Flexibility and Compatibility: It can connect with nearly any database or information source, making it versatile across various environments or sectors.
- User-Friendly Interface: Features a drag-and-drop interface that simplifies visualization modifications without requiring deep coding knowledge.
- Advanced Features: Includes advanced analytics like predictive modeling, forecasting capabilities, and natural language query support.
- Prebuilt Templates: Tableau offers hundreds of prebuilt templates, allowing even inexperienced users to create complex visualizations.
Here’s what G2 reviewers dislike about Tableau
- Learning Curve: New users might find a steep learning curve in understanding and effectively utilizing its features.
- Cost Concerns: The expense for frequent usage, especially for more advanced features, can be high for companies or individuals.
- Limited Customization: Compared to rivals like Power BI or QlikView, Tableau’s visualization options are often less customizable, limiting the creation of unique graphics tailored to specific datasets.
- Dependency on Extensions/Plugins: For more advanced visuals, users might find it necessary to rely on third-party extensions or plugins, as Tableau alone may not suffice.
“Tableau’s one of the best tools available in market for BI analysts with many options for presenting data in tables, pie charts, heat maps, stacked bars, etc. But the server is occasionally slow and it can take long time to convert data.”
Source: G2
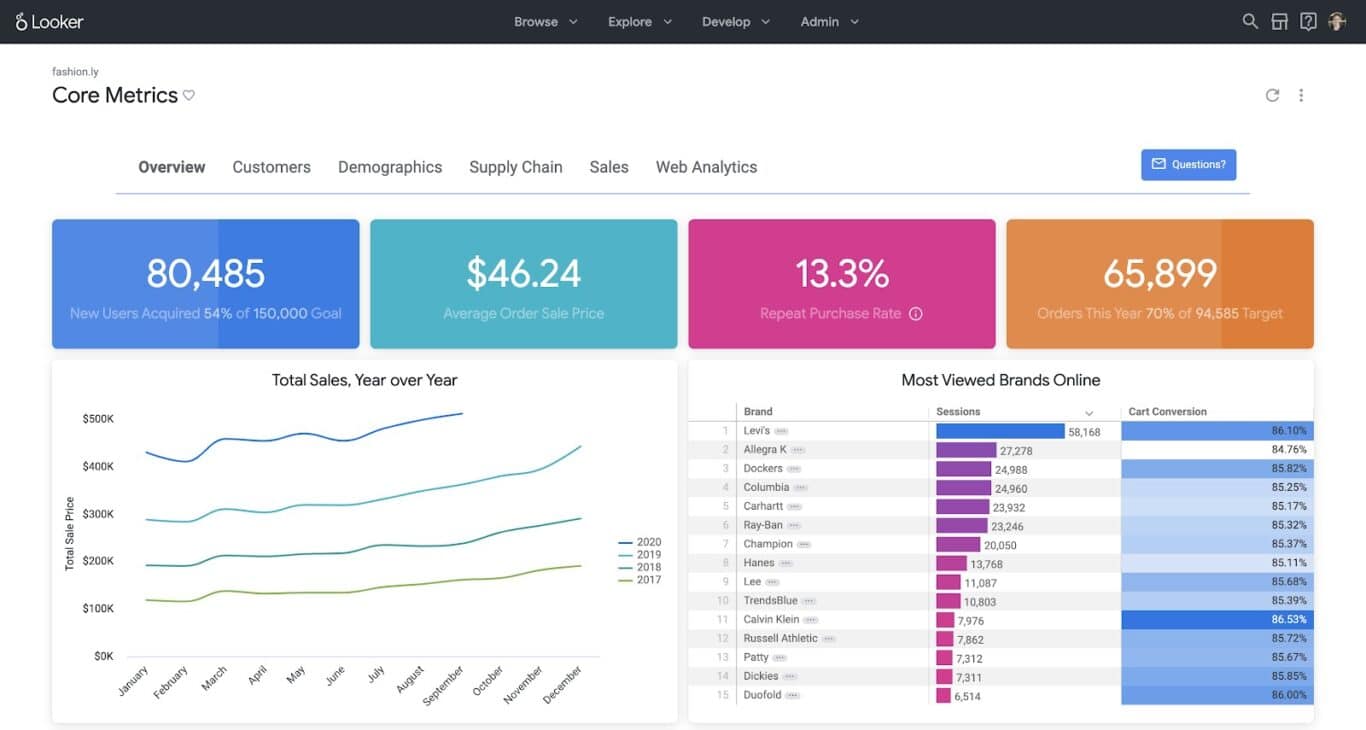
Looker
Looker is a powerful data analytics and business intelligence (BI) platform that we personally vouch for at Unito since our data team uses it every day. But we know that shouldn’t be part of the argument for or against, so we digress.
Launched in 2012 by Llyod Tabb and Ben Porterfield, Looker was founded with the aim of addressing the complexity and limitations present in traditional data analytics tools at the time. It was perceived as a more agile, user-friendly platform than its initial rivals including other key players on this list: Tableau, Microsoft Power BI, and Google Data Studio. So it’s no surprise that Google acquired Looker in 2019 for a cool $2.6B USD.
Here’s what G2 reviewers like about Looker
- Extensive Ecosystem: Looker benefits from a broad ecosystem of developers, startups, partners, and trainers closely associated with Google Cloud, offering a wealth of expertise and resources.
- Support for Startups: The Google for Startups program provides significant Google Cloud credits, which is highly beneficial for new businesses.
- Active Customer Community: The Google Cloud Customer Community (C2C) focuses on the issues and experiences of Google Cloud customers, featuring an active forum for discussions and support.
- WordPress Integration: Looker and Google Cloud integrate well with WordPress, supported by various plugins.
Here’s what G2 reviewers dislike about Looker
- File Management: At times, it is tricky to manage access to files and applications. This could cause delay or even losing access.
- Learning Curve: For few customization steps it might be difficult for newcomers, requiring them to review a lot of documentation.
- Pricing: Complex pricing structure and a smaller market share compared to AWS and Azure.
- Loading times: At times it can be slow and updates don’t come as frequently as users might prefer.
It may not be the most cost-effective option for small businesses with limited budgets, but Looker offers a wide range of features, benefits and it’s user-friendly data analytics platform that integrates with multiple data sources.
Source: G2
Looker Studio (formerly Google Data Studio)
We decided to keep these ones together so everyone’s clear and there’s no confusion. Formerly Google Data Studio, this dashboarding tool was renamed Looker Studio following Google’s acquisition of Looker. So if you’re confused (as the human author of this post was, at first), this should clear things up. Where Looker excels at data modelling and managing complex systems, Looker Studio can connect to over 1,000 data sources to help you create in-depth visual reports to showcase key metrics, KPIs, and other dimensions.
Here’s what G2 reviewers like about Looker Studio
- Easy to use: Users on G2 say they find it easy to create tables, maps, reports, and graphs.
- Integration with Google Cloud: As part of the Google Ecosystem, it easily integrates with other Google platforms and tools.
- Navigation: Data can be easily navigated without extensive tech experience. The interactive dashboard can be made within minutes.
- Data modelling: Data models are intuitively set up. You can give permission to selected users to avoid data breaches within and outside the organization.
Here’s what G2 reviewers dislike about Looker Studio
- Slow at Times: One user reported that if the data source table has an issue, then Looker Studio’s visualization can also be impacted, leading to slower performance.
- Pricing: Additional charges are applied while operating with large volumes of data.
- Unintuitive interface: The platform can be sometimes complex to navigate and understand, especially for those without a strong background in data analytics or programming.
The ability to connect multiple data sources to a single report is a game-changer for our agency. It streamlines the reporting process. But having limits on the number of charts you are able to use in a report is restrictive and definitely doesn’t allow us to present all of the information we would want to within the report.
Source: G2
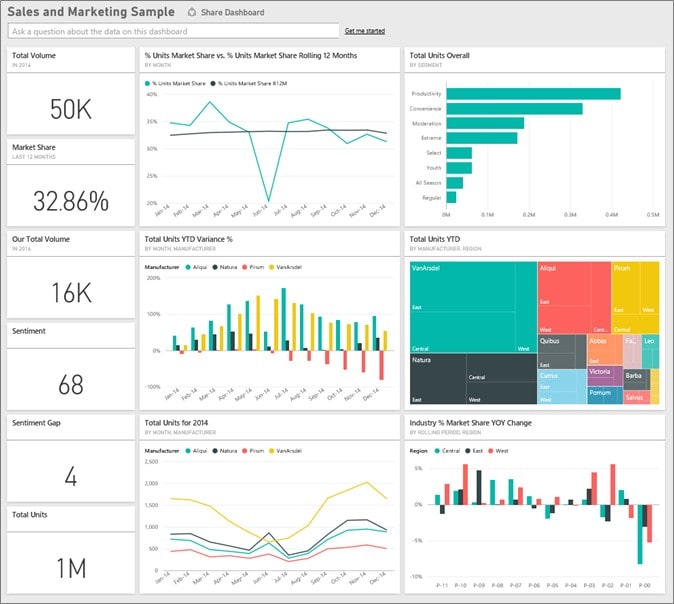
Microsoft Power BI
Microsoft Power BI was launched by Microsoft in July 2015 to compete with other leading data visualization tools of that time, including Tableau, IBM Cognos Analytics, Oracle Business Intelligence and SAP BusinessObjects, among others. While these other tools established themselves with strong offerings in the business intelligence market, Power BI distinguished itself with deep integration capabilities, an interface that was much easier to use, and the backing ofMicrosoft’s suite of productivity tools, including Excel.
With these advantages at-hand, Power BI has become a powerhouse in the data visualization category that simply must sit in any credible top 5 listicle out there.
Here’s what G2 reviewers like about Microsoft Power BI
- User-Friendly Interface: Its intuitive layout and drag-and-drop functionality makes it accessible to both beginners and experienced users. This ease of use reduces the intimidation often associated with data analysis tools.
- Data Integration: Microsoft Power BI excels (no pun intended) at integrating data from a wide array of sources, including databases, cloud services, and spreadsheets.
- Data Transformation: Power BI Desktop includes the Power Query editor, which simplifies data preparation and transformation. It allows users to clean datasets, pivot columns, merge tables, etc., without needing advanced coding.
- Customer Support: As a Microsoft product, Power BI Desktop has robust customer support, including extensive documentation, tutorials, guides, and a supportive online community.
Here’s what G2 reviewers dislike about Microsoft Power BI
- Learning Curve: Despite its user-friendly interface, beginners might be put off by a noticeable learning curve, especially those unfamiliar with data analysis concepts like DAX formula language and M code.
- Licensing Costs: While the basic version is free, advanced features require a Power BI Pro or Premium subscription, incurring additional costs. This could be a drawback for small businesses or individuals on a tight budget.
- Resource Intensive: The software can be demanding on hardware, especially when handling large datasets or complex calculations. This may result in slower performance or require more powerful computers, which could be a limitation for users with less capable hardware.
It’s amazing for synthesizing complex information into simple, beautiful, and intuitive charts. Users can include new visualizations through PowerBI itself, although stock is still limited, and other charts are only available via third parties.
Source: G2
Logi Symphony
Logi Symphony is designed for software teams to quickly create and integrate interactive dashboards and data visualizations, ensuring seamless access to modern data infrastructures. It’s known for versatile connectivity (it can connect to any data source, align with ETL, and its powerful BI capabilities make it suitable for medium to enterprise-level organizations.

Here’s what G2 reviewers like about Logi Symphony
- Excellent training materials and documentation
- Warm community and top-tier support services
- Versatile dashboard customizations
- You can use the APIs to add your own proprietary data connector.
- Structured BI marketing reports can be created and exported, printed, or shared with end-users.
- You can automatically visualize and interact with your data in a variety of ways without needing to prepare data in advance.
- For data analysis, it can connect and integrate with any source including OLAP, Excel, Big Data sources, relational databases, online services, and even basic text files.
Here’s what G2 reviewers dislike about Logi Symphony
- It can get tricky to use the more advanced features with your own script.
- The embedded analytics is programmer-centric, and while easy to use it’s dependent on the availability and skill level of developers.
- It could be made more user-friendly for beginners.
- It can be difficult to classify data at times.
Logi Symphony allows me to leverage business intermittency to apply metrics to our business strategies. The fact that it allows us to collect and organize data from different sources to make convenient representations through dashboards is truly valuable to us; moreover we have benefited from its analytical and reporting capabilities.
Source: G2
Unraveling the Benefits of Data Visualization for Marketers
Optimized data visualization can drastically make a difference when it comes to setting up a marketing dashboard or strategizing key marketing decisions. It’s like solving a Rubik’s Cube in just a few seconds. Graphs, charts, and heatmaps can paint a vivid picture of market trends and customer behavior, making it easier to gauge and react to marketing efforts.
Emerging Trends in Marketing Data Visualization
Bursting onto the scene are several new trends and technologies in data visualization that have led to a thunderous applause in the marketing landscape.
The rapid evolvement of technology has dealt a hefty blow, triggering advancements in data visualization. The use of sophisticated algorithms for predictive analysis is becoming a popular choice for marketers. These refined algorithms can crunch vast amounts of data swiftly, yielding impressive results in form of explainable and useful trends.
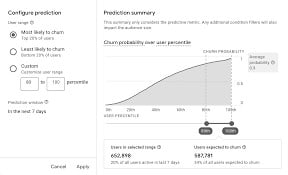
In the stride for personalized user experience, marketers are harnessing the power of AI-infused visualization tools, such as GA4’s predictive metrics functionality. This predicts a future where AI will be a key player in visualizing data for decision-making in marketing.
Predictions for Future Data Visualization Trends
Having tracked the trajectory of current trends, let’s shift focus and look into expert forecasts on data visualization in marketing reporting.
Predictive analytics in a post-AI world
Predictive analytics looks set to dominate, with experts tipping it as the next big thing to look for in 2025 marketing campaigns. Fueled by their robust processing capability, the use of AI and ML in data visualization is expected to broaden, thus enabling marketers to swiftly understand and utilize complex patterns.
AR and VR are on the rise again
With the spotlight steered on VR and AR, the future looks hopeful. As of November 2023, Statista reported the AR & VR market will reach at least US$32.1bn in annual revenue. That market is expected to further grow at an annual rate of 12.60% (CAGR 2023-2028) for a projected market volume of US$58.1bn by 2028.
Prepare for the emergence of an era where AR/VR based interactive data visualization becomes the go-to tool for marketers.

Undeniably, all these predictions can be overwhelming. However, to stay ahead of the curve, marketers need to stay plugged into these trends, adapting and evolving along the way. This flexible approach will keep them suitably armed to harness the full potential of marketing data visualization for their businesses.
Victory lies not in outpacing others, but in outperforming yesterday’s version of oneself. So take the long view, adapt, evolve, and prepare to be wowed by the tech-injected future of marketing data visualization.
Key Factors to Consider When Choosing a Data Visualization Tool
In the myriad of data visualization tools available to marketers, picking the best fit requires a keen understanding of various key factors. In this backdrop, we will wade through these variables, mapping out how they could influence the profit and productivity of your business.
Cost evidently measures in as a crucial driver for a majority of businesses seeking data visualization tools. The right tool for your business should be within your budget range and deliver an impressive return on investment. Look for reliable vendors who offer value for your money, without compromising on quality and scalability.

Usability is the cornerstone of efficient data interpretation and decision-making. The tool should be easy to use, enabling your team to extract insights without dedicating extensive man-hours to studying complex interfaces. It would be such a waste of resources if your team spends more time learning the tool than actually applying it to your data.
Finally, consider the tool’s integration capabilities. Can it easily collaborate with your existing tools and systems? Seamless integration reduces the need for additional infrastructure adjustments, thereby saving you from potential headaches and unexpected outgoings.
Steps to Implementing a Data Visualization Tool
Once you’ve identified the right data visualization tool for your business, it’s time to integrate it into your marketing data analytics strategy. Here’s how to go about it:
Define your objectives
Clearly outline what you aim to achieve with data visualization. These could range from identifying trends for future marketing campaigns to increasing conversion rates.
Data Compilation and Cleaning
Collect your business data and ensure it’s clean, accurate and relevant. Poor data quality can lead to inaccurate visual interpretations which could mislead your decision-making process.
Choose the appropriate visualization
Not all data is created equal, and, likewise, not all data should be visualized the same way. Pick a visualization that best represents your data and objectives. Make your selection from a vast array of charts, graphs, heat maps, etc.
Review and Adjust
Continually evaluate the utility of the visualization tool and tweak your visualizations whenever necessary. This could entail altering your chart types, adjusting the data range, or experimenting with different colors until you attain the best comprehension and insights.

Remember, no two businesses are alike. What worked brilliantly for another might not have the same impact on yours. Assess, strategize, integrate, and gather insights. Use the harvested intelligence to propel your marketing efforts ahead of the competition. With the right data visualization tool, your marketing data will transform from mere numbers to comprehensible, actionable insights.
The future of data visualization
As 2025 approaches, the power of data visualization in marketing reporting is almost indisputable. Success pivots around connecting tools that intricately marry dynamic design with data analytics. Slick and substantive visuals can resonate deeply, creating an emotional bond with your brand.
Don’t just appreciate the value these tools bring, wield it. Explore these trends, the ones moving towards real-time data visualization, and potentially interactive graphics. Your marketing narrative will bloom where complex data simplifies into engaging, understandable content.
Curious about where to begin? Think about your current marketing campaign. Which data points could be transformed into visual content?
With the right tools, your daunting data pool morphs into an ocean of opportunities. Celebrate the wins, learn from the curves. And always, remember, the most compelling stories are ones well told.