
What Is Dashboard Reporting?
Picture the dashboard of a car — a perfect analogy for the concept of dashboard reporting. How much gas is in your tank? How many miles have you traveled? Will you need to get an oil change soon?
Just as a car’s dashboard provides essential information – fuel levels, mileage, maintenance alerts – without the need to inspect the engine, dashboard reporting in software offers a comprehensive view of various metrics at a glance.
This real-time knowledge empowers data-driven decision-making for marketing teams, operations, product, and other departments.
At a glance, you can see how the whole system is doing. You don’t need to pop the hood or go to a mechanic. You can figure it out yourself.
Dashboard reporting is the same basic concept for software. It brings you real-time knowledge, so you can make data-driven decisions.
Today, we’re explaining the basics of dashboard reporting, the main types to look out for, how it’s different from traditional static reporting, and how it can help you work better. If you don’t know which tools you want to use for dashboard reporting, here’s a guide to the best apps for marketing reporting including dashboards, in 2023.
Understanding Dashboard Reporting
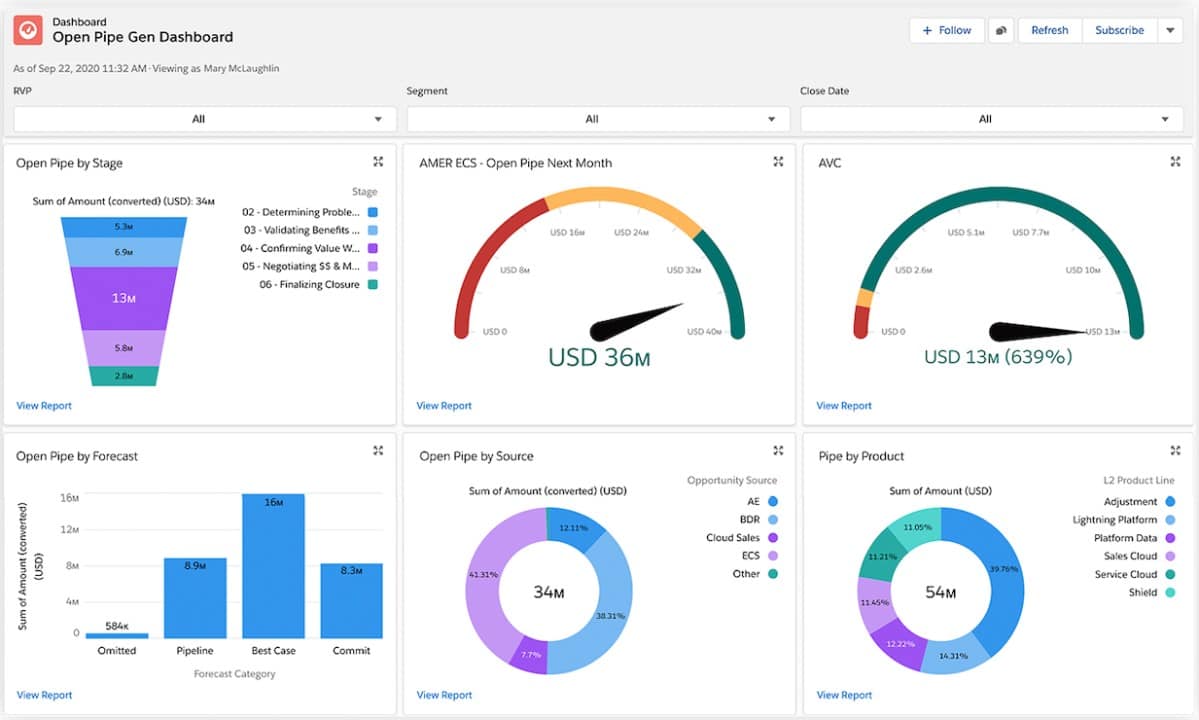
In a software environment, a dashboard is the central hub that displays selected metrics through visual aids such as graphs and charts.
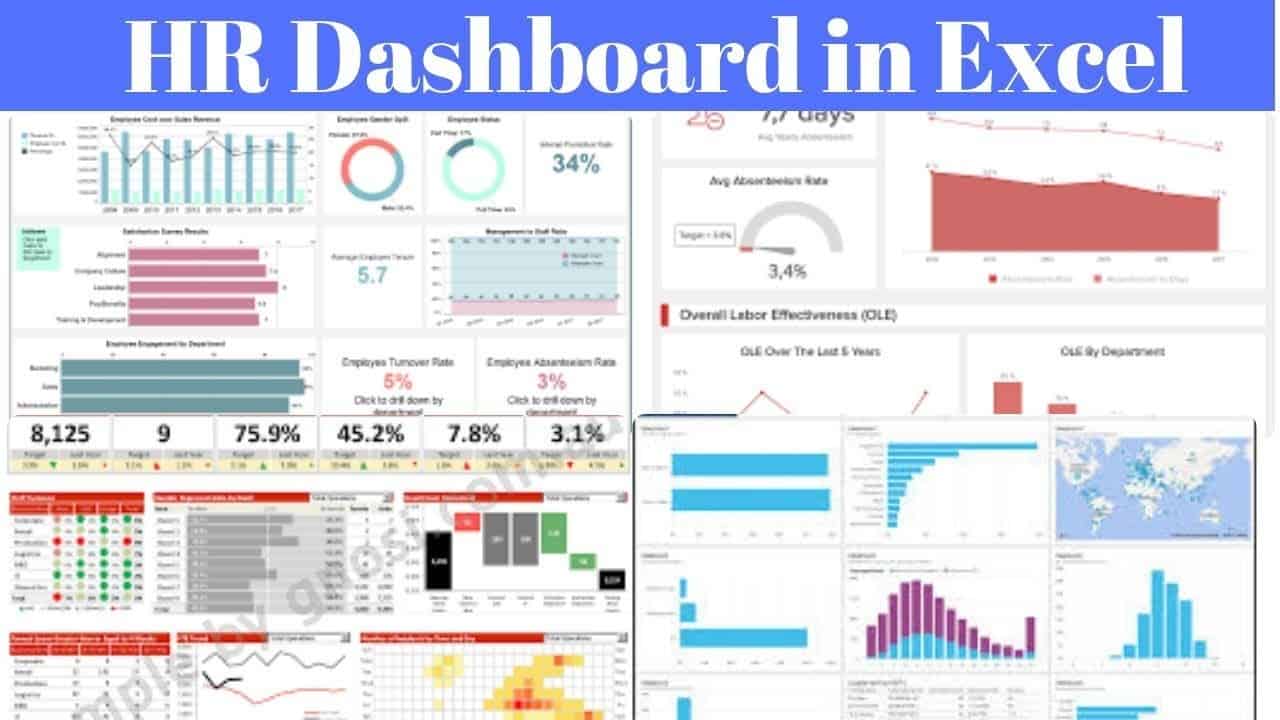
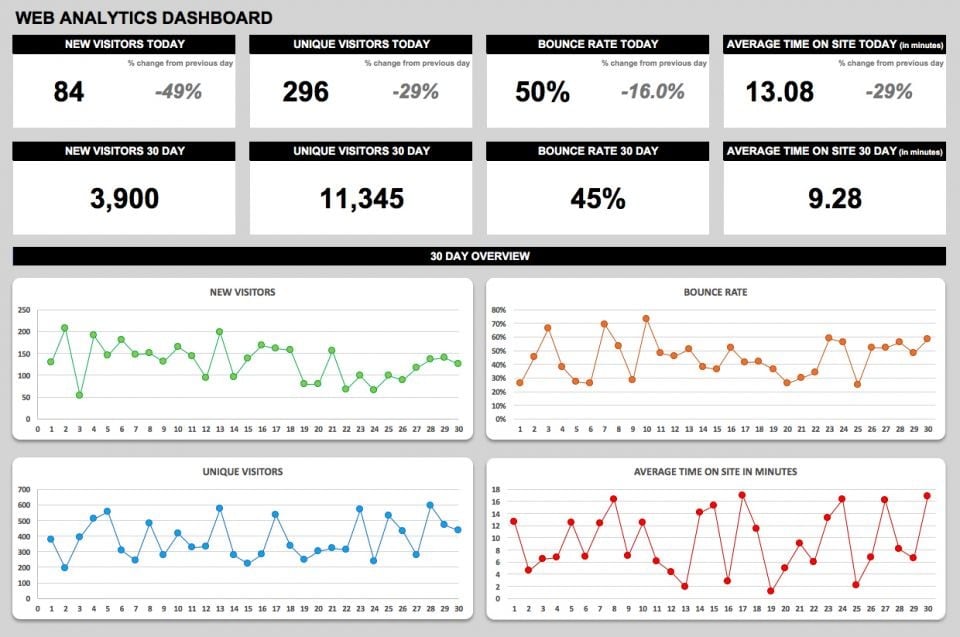
An HR dashboard might illustrate payroll distributions and employee statistics, while a web analytics dashboard, such as Google Analytics 4 (formerly UA), offers insights into website traffic and user behavior.
Dashboards enable a holistic view of disparate data points, facilitating an understanding of their interrelationships.
Comparing Dashboard and Static Reporting
Dashboards and static reports both help you share metrics and data. But the two couldn’t be more different in form, content, or practical application.
Dashboard reporting
Dashboards are always web-based, viewed through a browser or software tool. They’re constantly monitoring data in real-time, and sharing the results as visualizations. Dashboards are generated automatically, though you might customize them to your needs.
They’re often interactive, meaning you can click on the metrics and drill into them further. For example, you might click on that payroll graph from the HR dashboard, to see what proportion of it has gone to certain departments or teams.
Static reporting
Static reports share a snapshot of your data at one moment in time. While you might view them online, they’re usually in a non-web-based format, like a spreadsheet, PDF, or Powerpoint presentation.
Uses for static and dashboard reporting
Both static reports and dashboards have their place. Dashboards are best used to check in on the health of your system, and make small, ongoing adjustments to your strategy.
Static reports are a good tool if you’re making long-term, strategic decisions, especially if they involve multiple people. For example, you could create a static report on your social media performance each quarter, and present it at a team meeting before making your next content calendar. Here’s more on static vs. dashboard reporting.
Benefits of dashboard reporting
Dashboard reporting is powerful because it gives you instant, ongoing access to data that you can use to make strong decisions.
Checking in on the health of your business or system can become just another part of your daily workflow. You’ll catch trends early, so you can take action to correct negative outcomes and double down on positive ones.
It’s also a huge time-saver. You don’t need to do any extra work to generate a report, or dig up a particular metric — just check out the dashboard and understand exactly what’s happening, right now. Save the static reports for when you need to make big decisions, and widely share findings across your company.
The 4 types of reporting dashboards
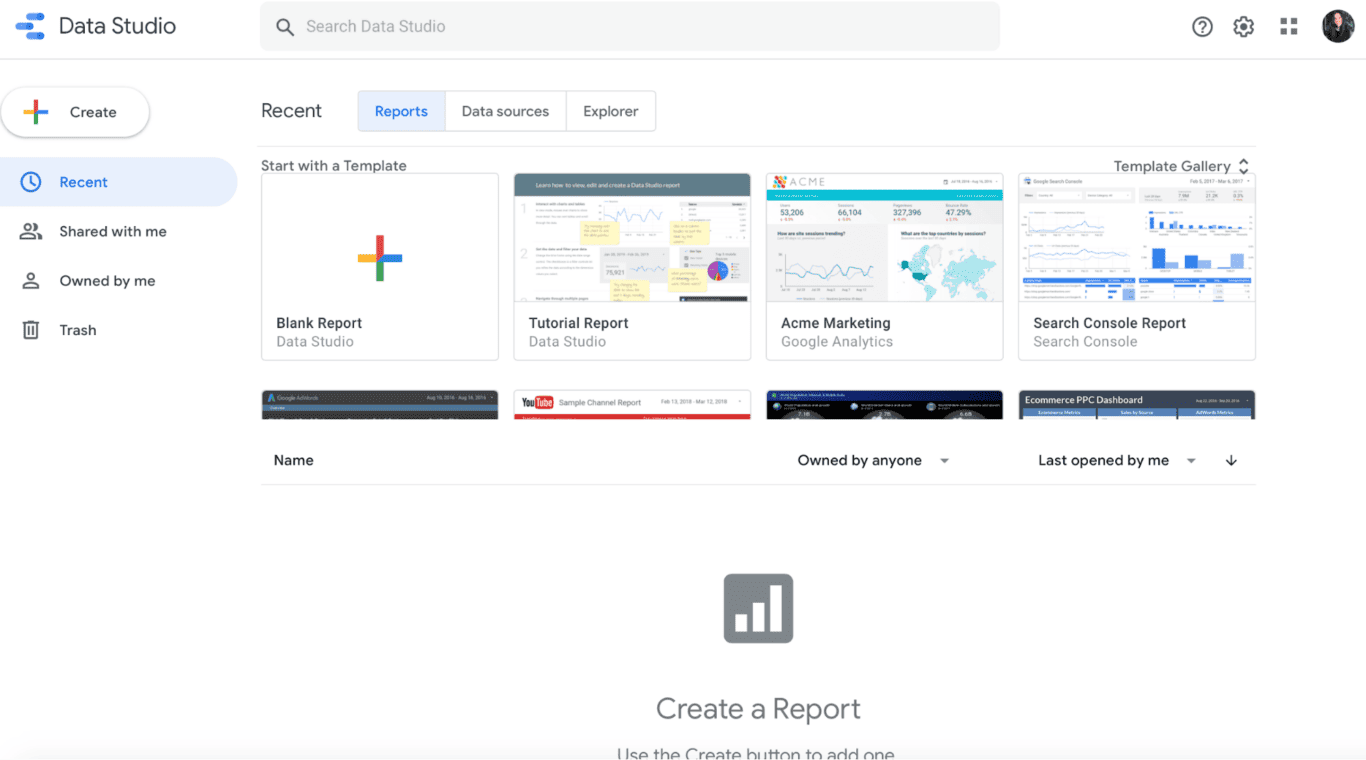
Nearly any industry that generates data, from marketing to healthcare, uses dashboard reporting to make sense of it. There are many industry-specific dashboard solutions. Other tools that can be used to make dashboards, like Looker, Tableau, and even Excel.
There are four main types of reporting dashboards, best-suited for different types of tasks. They break down as follows:
Operational dashboards
The most basic type of dashboard, showing you real-time data and metrics to reveal what’s happening within a system. Tools like Google Analytics are operational dashboards. They’re used within teams and by individual contributors to bring data into their daily workflows.
Analytical dashboards
More advanced dashboards, often designed for professional data analysts. They report on more complex trends, and have more powerful drill-down capabilities, than an operational dashboard. Most enterprise-grade analytics tools offer this kind of dashboard.
Strategic dashboards
Used by senior leaders, to track broad, strategic performance and progress towards KPIs from across an organization. They’re geared towards long-term over day-to-day decision-making, so they have more in common with a static report than your typical dashboard.
Tactical dashboards
Tactical dashboards are like a mid-point between strategic and operational dashboards. They help middle managers track how those big, strategic goals are translating into action by sharing real-time metrics. They often display KPIs, along with specific metrics that support them. For example, in retail that might be sales per store, or in customer support, tickets resolved per team.
Dashboard confessional
Everyone wants to trust in their choices at work — to know they’re based on evidence, not just gut feeling.
Dashboards make that ideal much more realistic. They give you access to data in a centralized place, and make it easier to understand with visualizations.
If your work involves data (and what doesn’t, these days) dashboards can help you work better. Whatever field or industry you’re in, here’s hoping your dashboard brings you surprising, delightful, or even revolutionary insights.