
13 Types of Reports (And What They’re For)
No matter what type of role you have, chances are that if you work in an office environment you’ll encounter some type of report from time to time. While you may think that reports are all pretty much the same, there’s actually a different type of report for every business need.
Whether you need to show your boss your social media growth or provide an update on the status of a project, there’s a specific report that can help you do that. Continue reading to discover different types of reports, what they’re for, and the tools you can use to create them.
Social Media Report
Purpose
Social media managers have to track and manage huge amounts of data every day. From follower growth to IGTV views, there are a number of different metrics they need to be actively monitoring and reporting on.
A social media report gives social media managers a way to track and analyze their data and prove the ROI of their efforts. Just like there are a variety of types of reports in general, there are various kinds of social media reports. A social media report prepared for the social media manager’s boss, for example, would look different than one they’ve put together solely for their own reference and goal-setting needs.
Tools and Examples
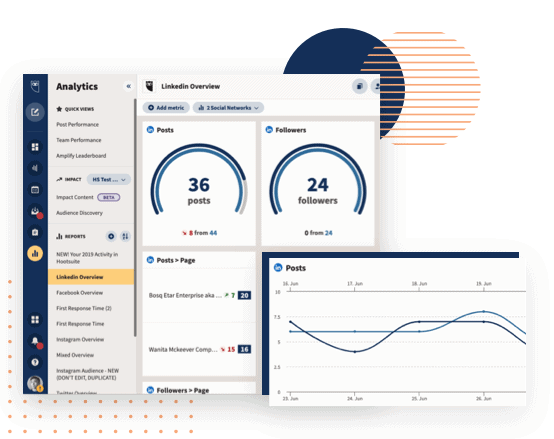
A social media report can also be something a social media manager creates themselves (based on data they monitor) or generated through a native social media platform or scheduling tool.
For example, a social media manager can use Facebook’s Insights feature and export their Facebook and Instagram analytics for their report, or use a tool like Hootsuite’s Analytics to collect data and create a report for one or multiple social media accounts at once, from one dashboard.
Google Analytics Report
Purpose
A Google Analytics Report can help you track how users and customers interact with your website over time. With a Google Analytics (GA) Report, you’re able to see various GA metrics all from one dashboard. While there are hundreds of metrics you could track using Google Analytics, the reporting tools available ensure you’re able to see the most important data and information for your business at a glance.
There are a number of standard preset reports you can use within Google Analytics, including Realtime, Audience, Acquisition, Behavior, and Conversions reports. For example, an Audience Report will show you data such as who is coming to your site and how long their sessions are as well as page views and bounce rates. In addition to these standard reports, you can also create custom reports within Google Analytics.
Tools and Examples
This type of report can either be created natively within Google Analytics itself, using an Excel spreadsheet or Google Sheet, or through an external automated reporting tool.
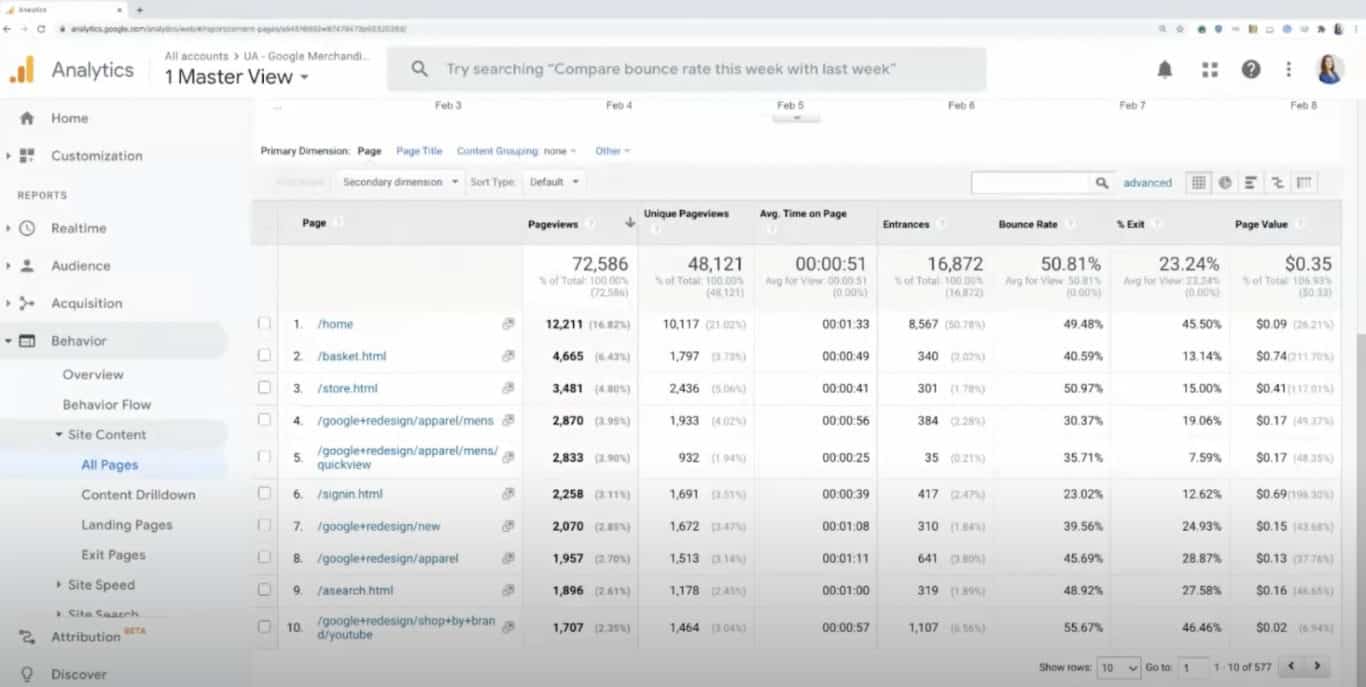
For example, if you want to create a report on the number of page views your site has, you can use Google Analytics’ built-in reporting tool. Here you’d get a breakdown of the pages on your site that get the most visits, the audience member’s average time on page, bounce rate, and the monetary value of each page. From here, you can then export this data and include it in a greater Google Analytics report, or use it as your sole reporting document.
Proposal Report
Purpose
A proposal report is a document created to show how one business can help another business. Proposal reports are usually prepared in response to a business or organization issuing an RFP, or Request for Proposal.
A proposal report must show the recipient exactly how the sender can help them meet their business needs. It must outline the project, propose a solution, and clearly define the anticipated outcome. Usually, organizations are receiving numerous proposal reports from a variety of businesses competing to “win” the project or client, so it’s important that a proposal report is completed thoroughly.
Tools and Examples
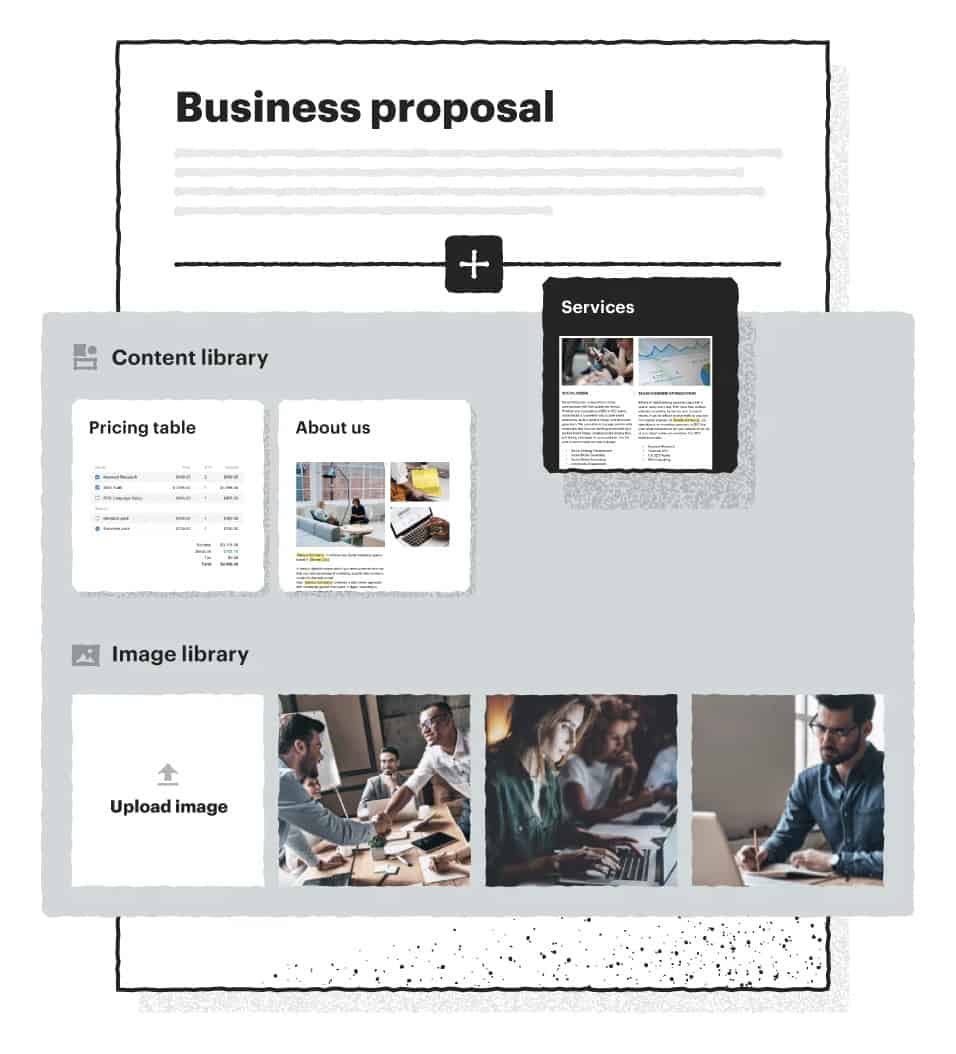
Proposal reports can take many different forms depending on your industry. For example, a branding agency responding to an RFP may create a PDF from a presentation deck in Google Slides or Microsoft Powerpoint as their proposal report.
Alternatively, businesses can use tools such as PandaDoc that enable them to create, send, and eSign client-facing proposal reports with pre-built templates and CRM integration.
Informational Report
Purpose
As its name implies, this type of report conveys information between two parties. That can be two businesses, two teams, or even two individuals. The data included and shared in an informational report is meant to be objective.
An informational report is not meant to propose solutions to problems or present hypotheses, but rather to bring forth information and facts that can help inform any necessary decisions in the future or as a result.
Tools and Examples
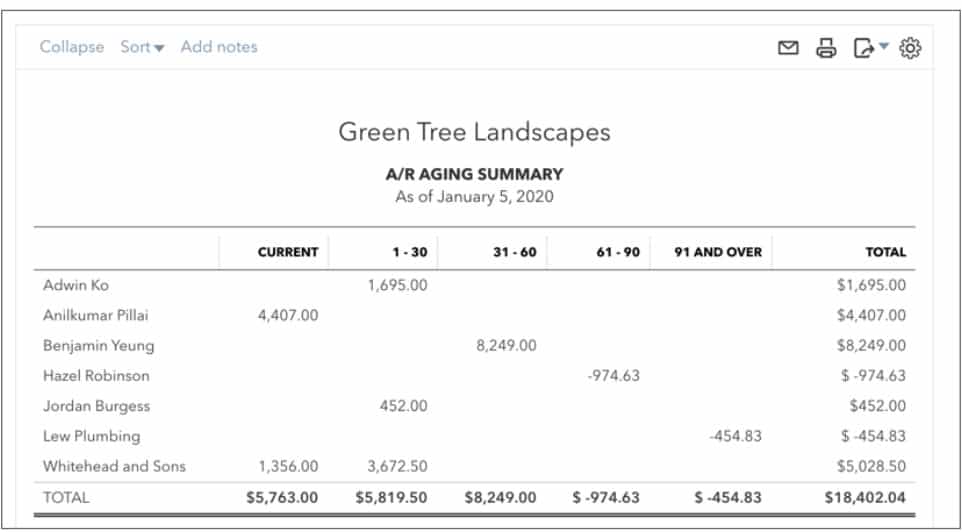
Informational reports can be formal or informal and as such, can come in many different forms. The tools used to convey information and data can be as simple as something like Microsoft Word (ie. for an informational report sharing annual general meeting minutes) or more complex like Quickbooks (ie. for financial reports).
Other examples of informational reports include annual reports, monthly financial reports and earnings, and real estate appraisals.
Periodic Report
Purpose
When a report is referred to as a “periodic report,” this simply means that it is being provided at regular intervals. These are used to share the performance status of various items within a business or organization to clients or more senior individuals.
Many other report styles can also be classified as periodic reports. For example, if your client requests a Google Analytics report every week, this can also be considered a periodic report.
Tools and Examples
As periodic reports can be used across all industries, the sky’s the limit when it comes to the tools you can use to create this type of report. For example, periodic reports can include email marketing reports, project progress reports, incident reports, social media reports, Google Analytics reports, or feasibility reports.
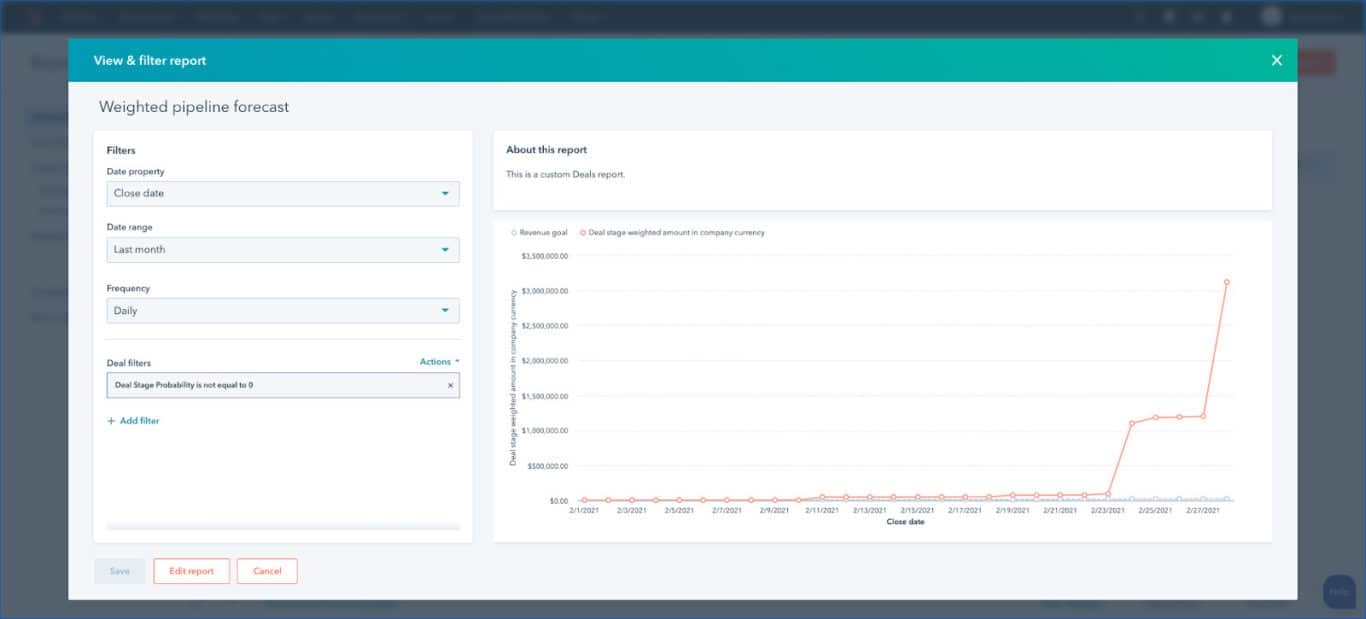
Let’s take a sales report as an example. Here, you might use a tool like HubSpot to gather insights and create a regularly occurring report for both your team and upper management to view. HubSpot’s sales report tool offers more than 90 prebuilt report templates so you can easily and consistently provide regular and reliable sales reports to anyone across your organization.
Try these popular Unito integrations:
Long Report
Purpose
Any report that is greater than ten pages in length is considered a “long report.” These are used to share in-depth information that requires the inclusion of extensive detail and context.
Long reports are typically more formal in tone and content. They follow a more structured format, avoid any subjectivity, and any other potentially distracting or bias-inducing elements such as personal pronouns (I, we, us).
Tools and Examples
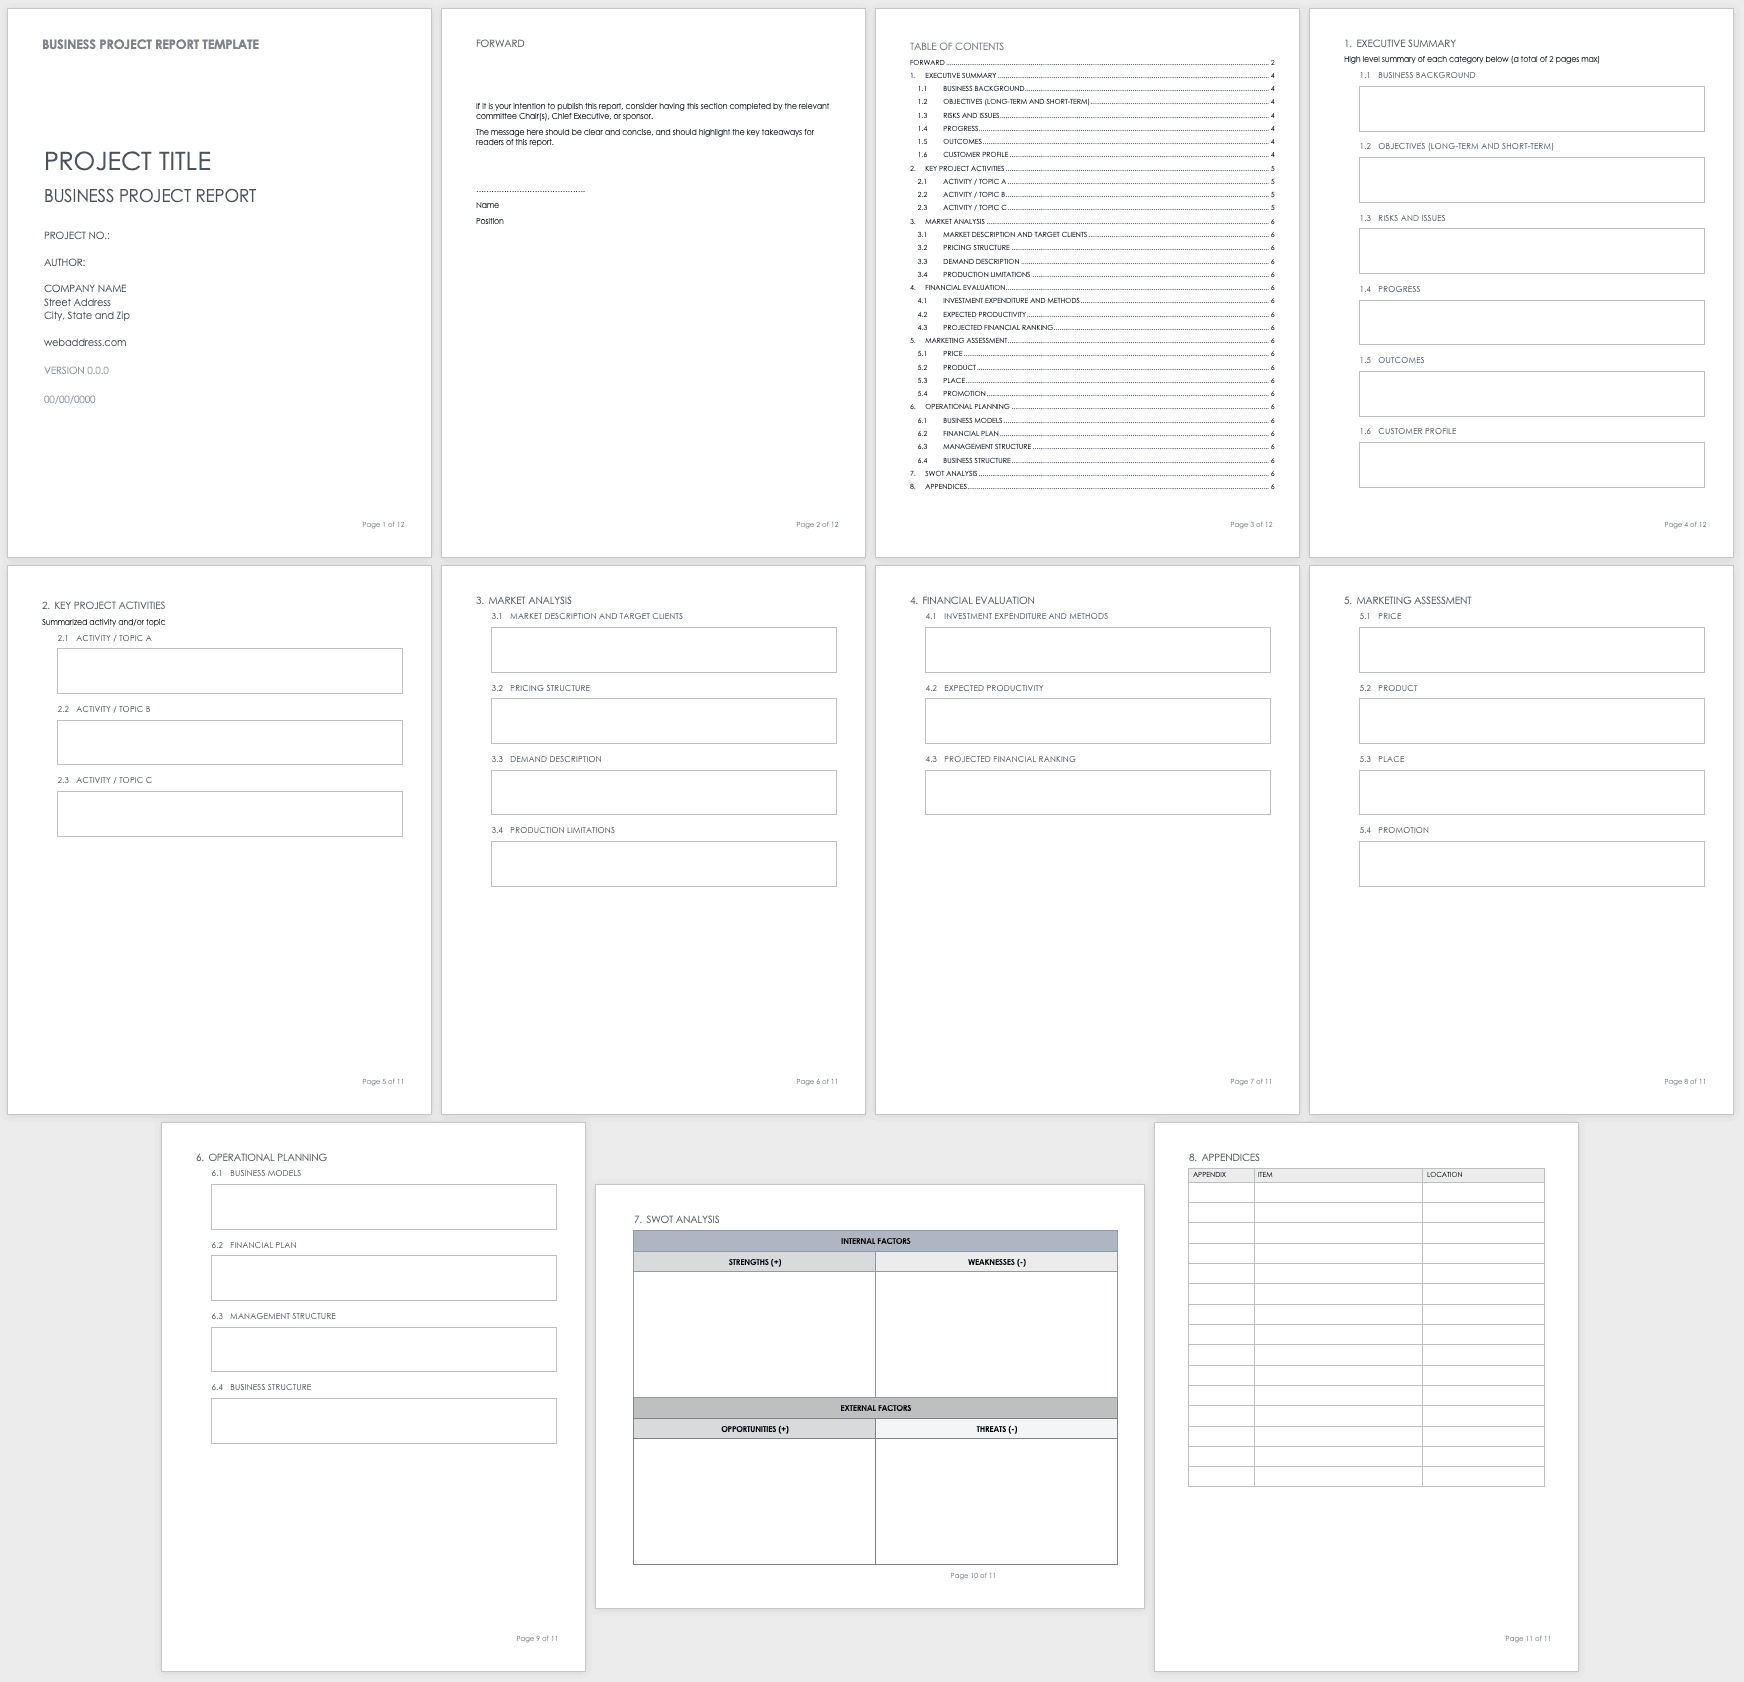
Examples of long reports include white papers, legal reports (such as court proceedings), feasibility reports, business proposals, research reports, and business plans.
The majority (if not all) of these types of reports will be created in word processing software such as Microsoft Word or Google Docs. Some examples of a business plan, a form of long report, can be found here and here.
Project Health Report
Purpose
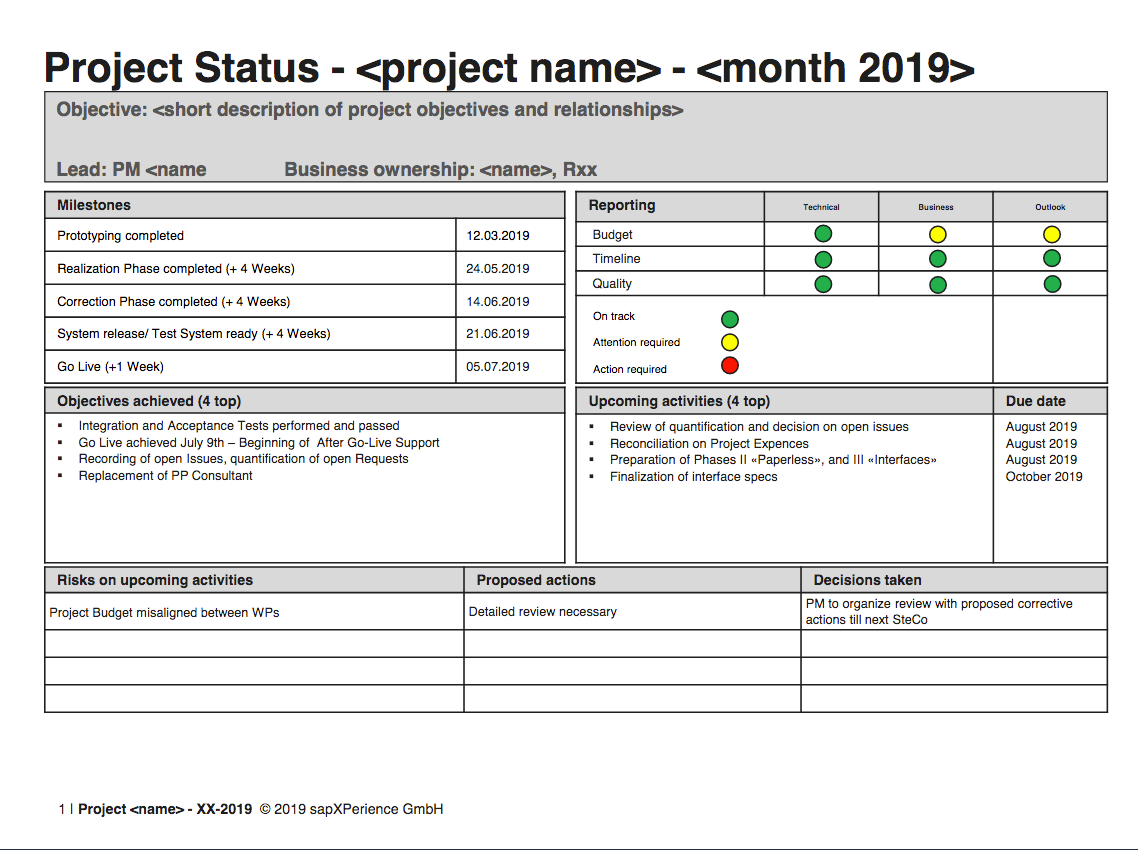
A project health report is used to update stakeholders with high-level information about a project, as well as track progress and its overall status. These help keep stakeholders and the project team aligned on the goals, purpose, and direction of the project.
If a big project is only shown to stakeholders once all of the work is done, chances are there will be edits and feedback to implement. With regular project health reports, stakeholders and project managers are able to course correct when necessary — before the majority of the work is done.
Tools and Examples
While you technically could create a project health report manually through something like Excel or Google Docs, it’s best to streamline the process in accordance with your project management tool of choice.
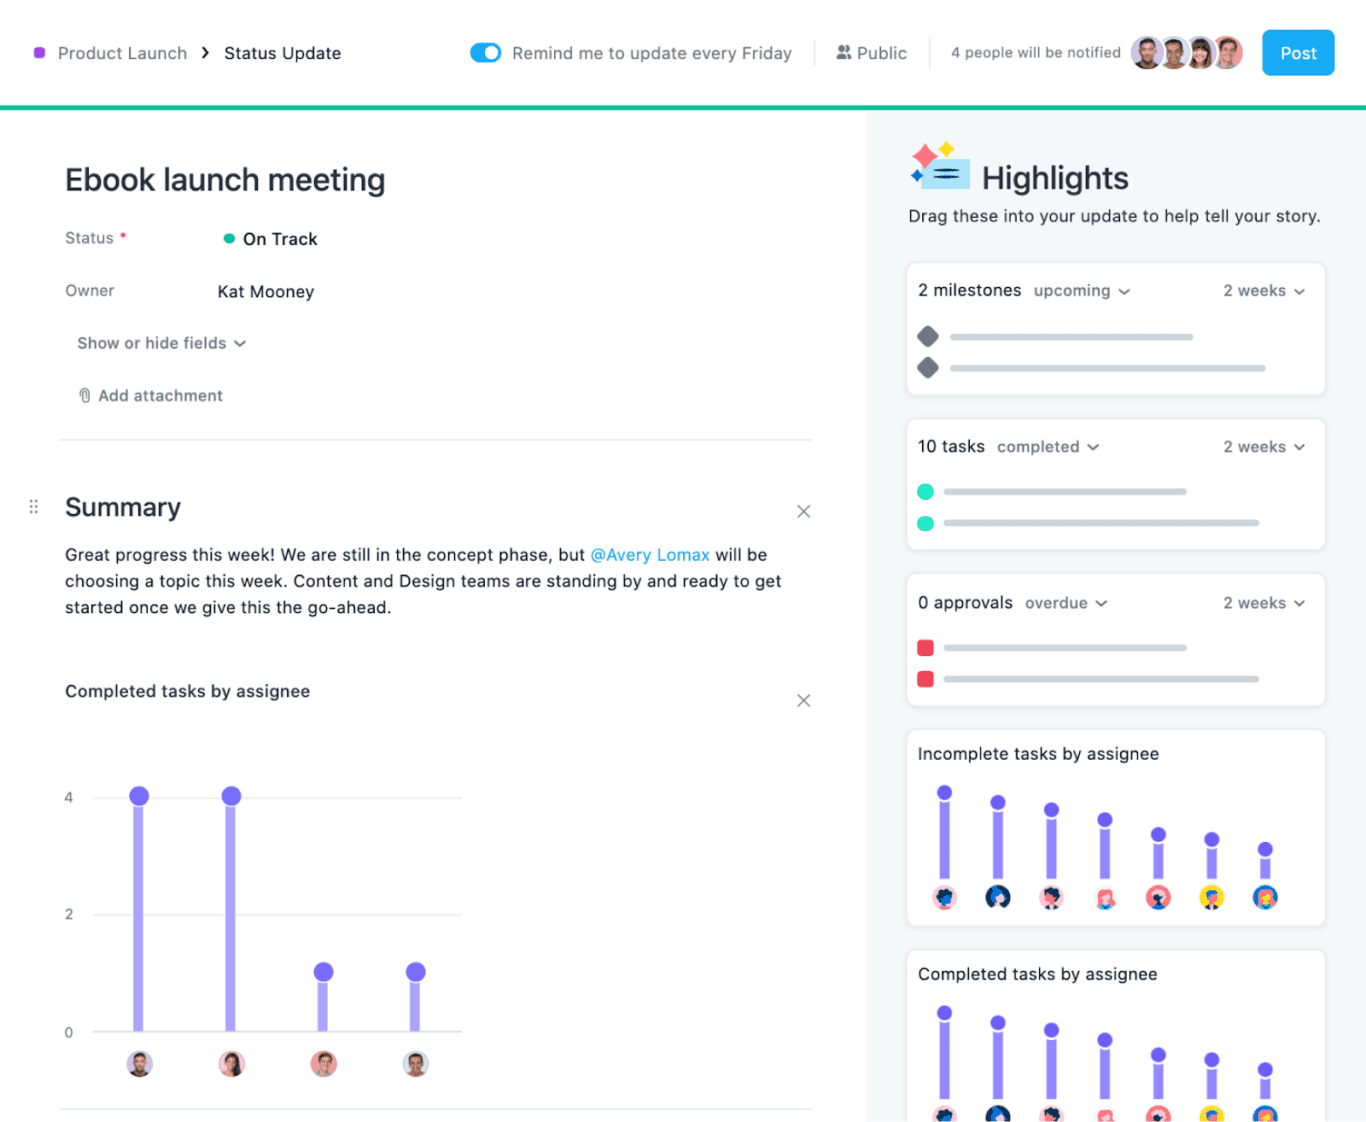
With project management software such as Asana, for example, you’re able to view information in a Gantt Chart, Kanban board, spreadsheet-style view, or calendar and create project health reports with a single click.
Try these popular Unito integrations:
- Airtable + Microsoft Excel
- Microsoft Excel + Asana
- Microsoft Excel + ClickUp
- Google Sheets + Microsoft Excel
- Microsoft Excel + Trello
External Report
Purpose
Not all reports are internal reports. External reports are created with the intention of being shared beyond the organization. They’re often used to share information with the general public or shareholders. External reports help the public understand the financial health of an organization, can help attract future investors, work to boost brand awareness, or fulfill the rights of citizens within a governmental body.
External reports can be voluntary; released by an organization for the purpose of accountability. They can also be made mandatory, usually by some legal requirement, such as financial reporting from publicly traded companies.
Tools and Examples
Any report that is created for the purpose of being shared publicly is an external report. This type of report includes audit reports for government agencies, financial statements for publicly traded businesses, and any reports that include findings relevant to the broader public. For example, Apple provides its quarterly financial statements in the form of external reports in its investor relations portal online.
Vertical and Lateral Reports
Purpose
The labels “vertical” and “lateral” refer to the direction a report is traveling. Vertical reports are created for those either above or below someone in the organization’s hierarchy. For example, a report created for an employee by a manager, or by a manager to a senior level of the executive team.
Lateral reports are created and shared between members at the same level in an organization. An example of this would be a report from a marketing director shared with the creative director within the same business.
Tools and Examples
Examples of vertical reports include a performance review shared by a manager to their direct reports, an email marketing campaign results report shared by an employee to their superiors, or a project health report sent by a project manager to upper management and senior stakeholders.
Lateral reports can include time-tracking reports sent between project managers and working team managers (at the same seniority level), informational reports sent between members of a working team, or a financial report sent from the accounting department to the production team.
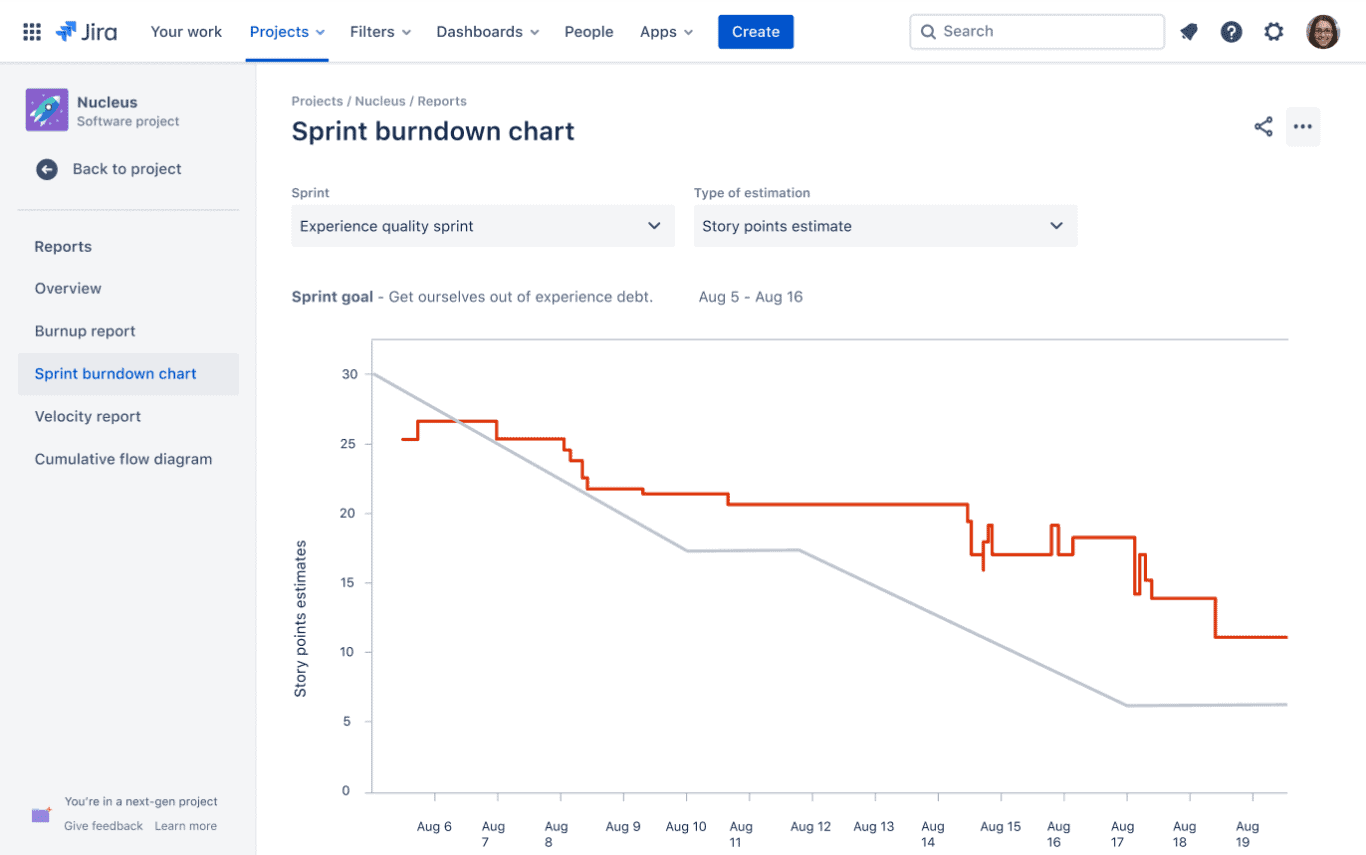
As the classification of vertical and lateral refers to the movement of the report within an organization and not the format of the report, a wide variety of tools can be used in their creation. For example, an agile report created by a project manager in Jira and shared with the working team lead (of equal seniority) is a type of lateral report.
Try these popular Unito integrations:
Analytical Reports
Purpose
When it comes to sharing data and insights, an analytical report is your best bet. Analytical reports help organizations understand the overall health of the business through documents that share information such as statistics and research findings.
While similar to an informational report, analytical reports go one step further to include predictions and solutions meant to help inform business decisions. Based on the data included in an analytical report, stakeholders in an organization can identify areas of the business that require more attention, and which are performing or exceeding expectations.
Tools and Examples
With an analytical report, you can either gather information from software or tools and combine it with insights manually, or use a tool that will create a report that includes both the data and insights in one. Examples of analytical reports include pay-per-click reports, marketing campaign results reports, budget reports, and feasibility reports.
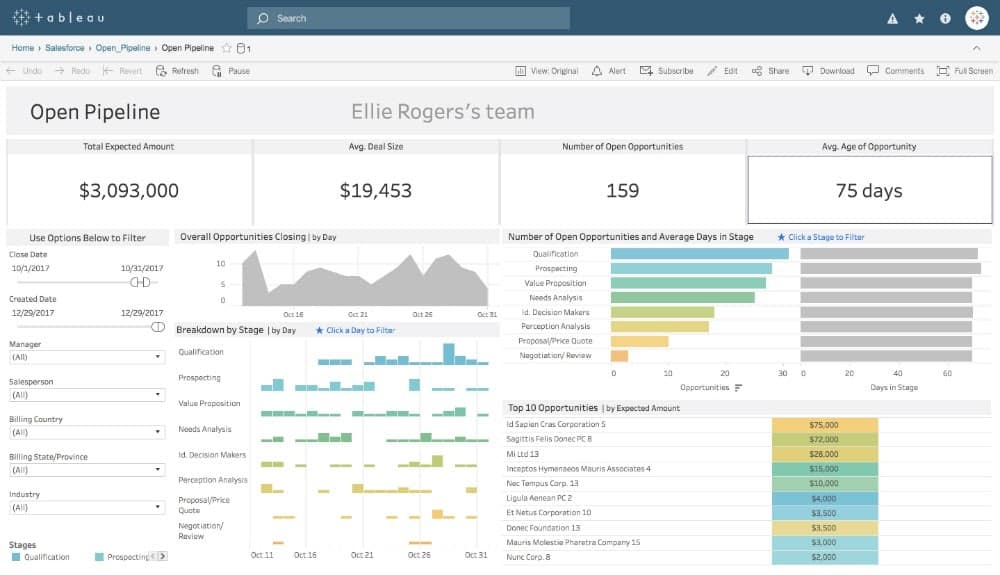
For example, you can create an analytical report in a tool like Tableau that provides both the raw data and statistics you need, paired with valuable insights. Using Tableau, you’re not only able to see the results of digital media spending, website performance, customer journeys, and social media analytics — but understand what this data means for your business.
Operational reports
Purpose
An operational report allows organizations to share key data about day-to-day operations, tracking metrics that tie directly to their success. It’s updated frequently and shows that data over several weeks or months, allowing you to see how these metrics evolve over time. This report is perfect for giving teams and leaders a snapshot of an organization’s essential metrics. It might be used as the basis for a check-in meeting or to feed other reports.
Tools and examples
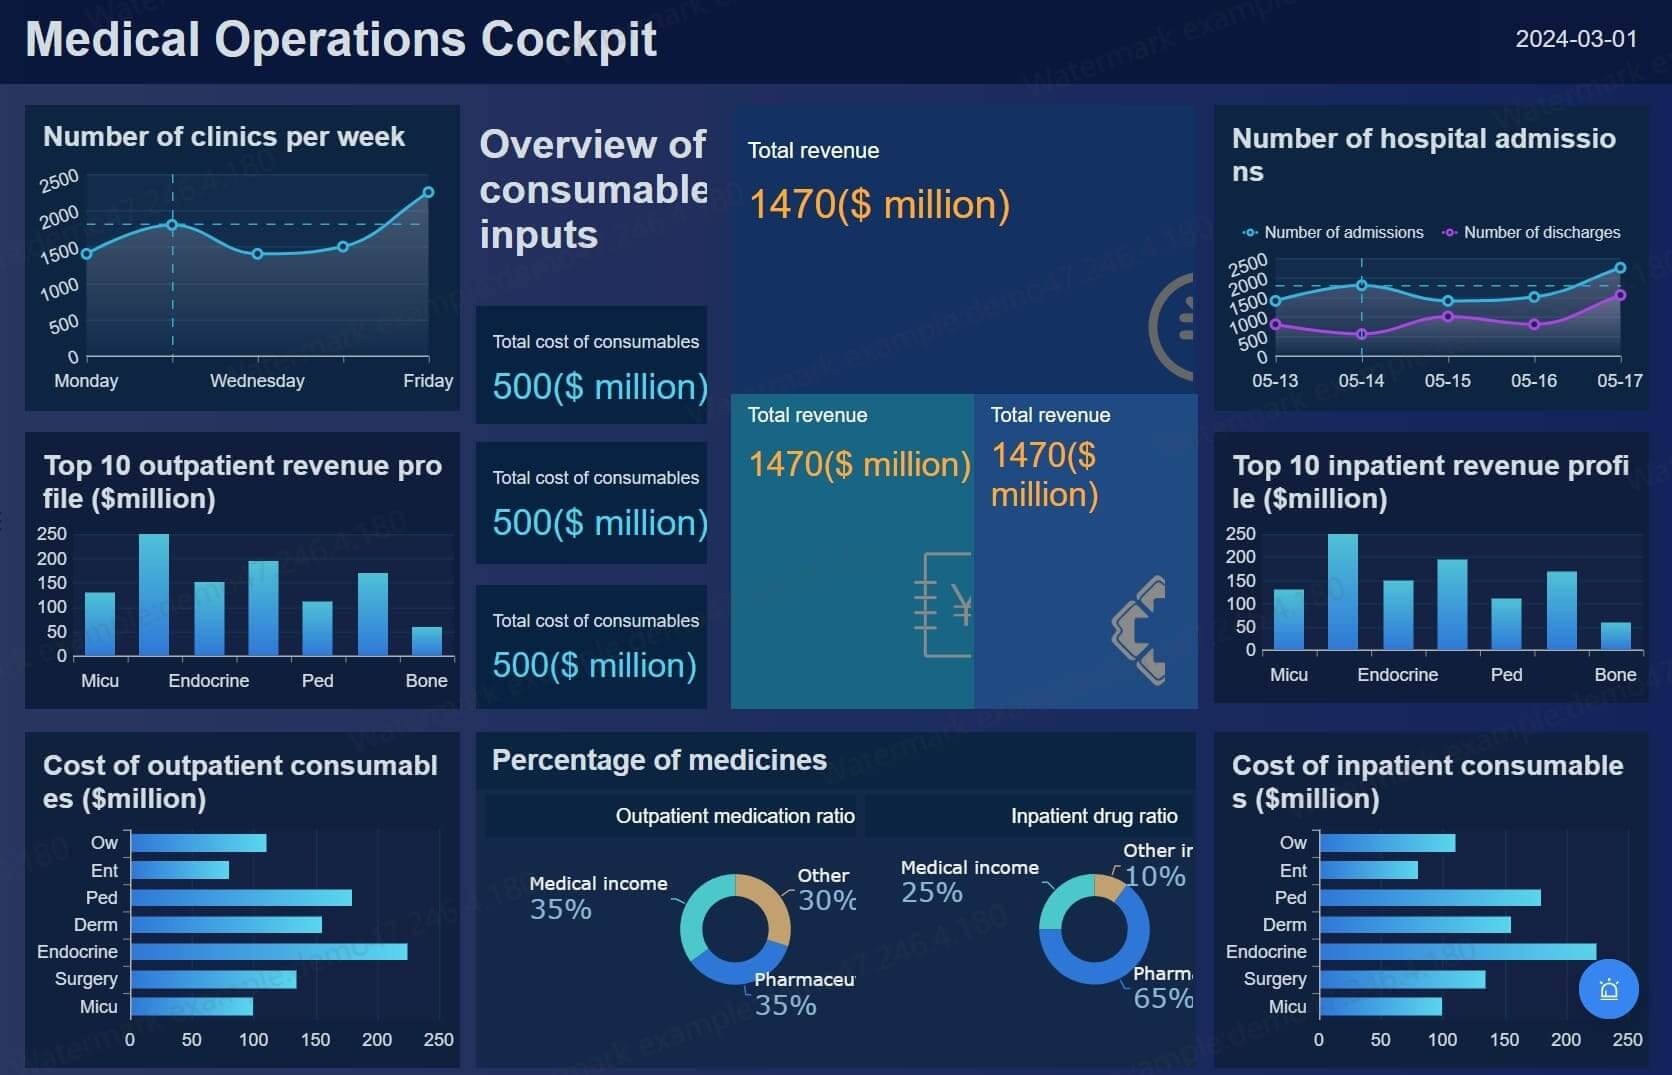
A manufacturer, for example, might create operational reports that track its inventory of parts, the health of its production lines, and its output in finished products. A tech company’s operational reports would instead track how many people signed up for its product, how much these customers bring in on average, and how many of them use different aspects of that product.
Tools you’re already using can allow you to build these reports. Project management apps can be used to build operational reports on essential projects, while tools like Tableau and HubSpot can be used to track metrics for tech companies.
Research report
Purpose
A research report is typically more in-depth than more informal reports. It involves a team — either within the organization or a contracted third party — taking a specific research question and getting to the bottom of it. That might involve running a survey with hundreds of respondents, cross-referencing research from multiple industries, or researching specific market trends. The goal of a research report can vary wildly, from exploring the potential for a new product to analyzing the competition.
Tools and examples
A research report will rarely involve advanced tools the way other reports on this list might. Usually, the research methods involved are more technical than the tools themselves. Specific tools might be used to look up and extract data, but the reports themselves are usually prepared using word processors or slideshow tools and delivered as PDFs.
Industry trend report
Purpose
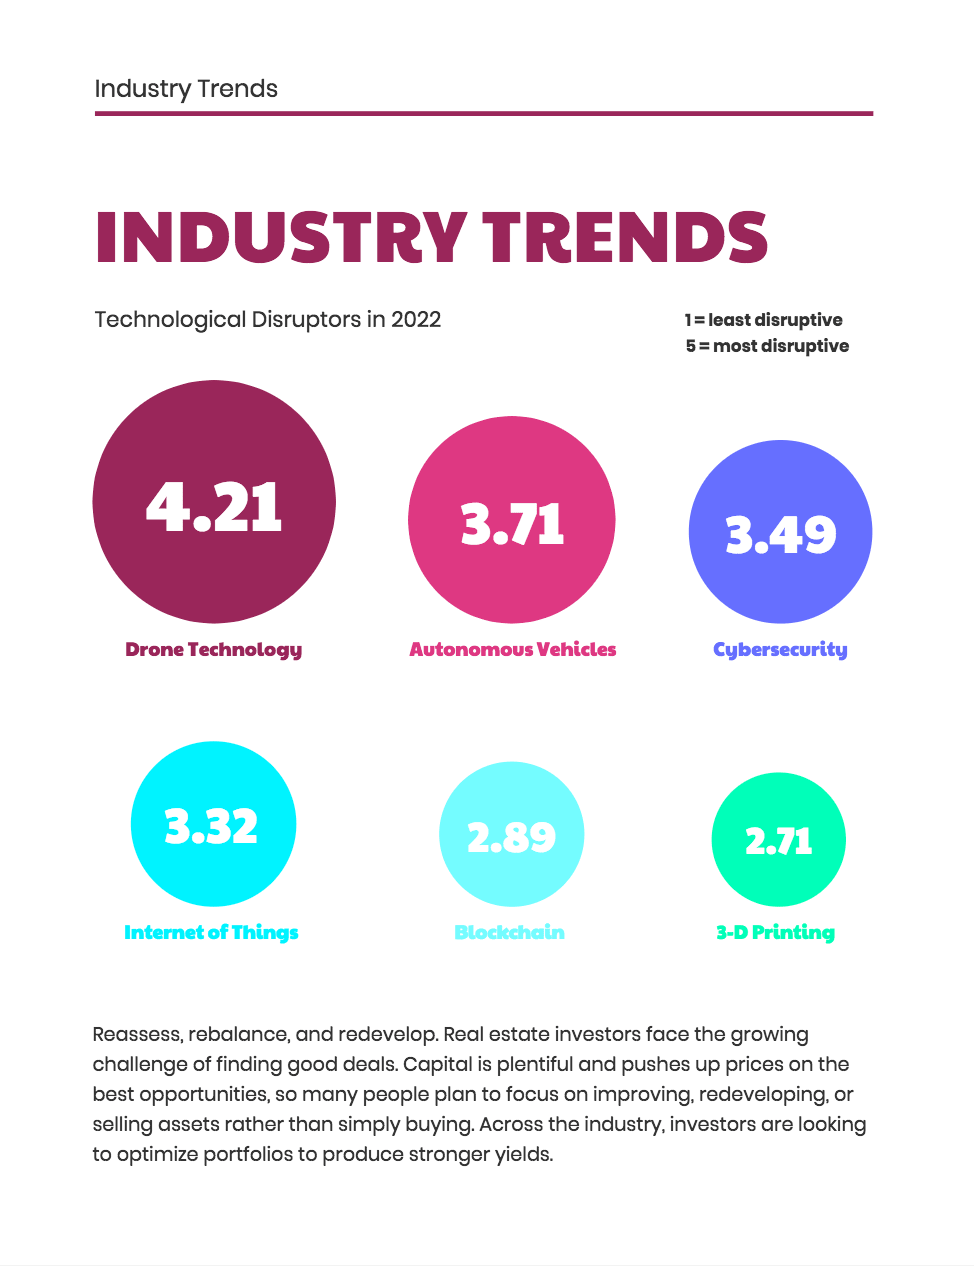
Your organization is an expert in at least one field, if not more. That means everyone from potential customers to business partners and even your competition might look to you for insights on specific trends in your industry. An industry trend report collects these trends, usually based on significant research. Organizations usually release these reports to establish their credibility as experts or as marketing materials to generate leads for their products.
Tools and examples
Usually, you won’t use any sort of dedicated tools for preparing industry trend reports. You might gather data from around your industry, read through reports from other sources, and even interview experts. When preparing these reports, you’ll typically use nothing more complicated than a word processor or a slide deck.
Popular examples of industry trend reports include HubSpot’s State of Marketing Report, Unito’s Report on Reporting, and the McKinsey Technology Trends Outlook.
Learn more in Unito’s Report on Reporting
Because reporting is such an important workflow, we wanted to get the lay of the land before building dedicated integrations for it. What are some of the biggest headaches that come with reporting? What tools do people use? How can these problems be solved?
That’s why we surveyed 150 knowledge workers from a variety of industries, asking them about their reporting workflows and their tool stack.
We poured through the data and broke it down in Unito’s Report on Reporting. Click the link below to get your free copy.
Get the ebook here
There’s a type of report for everyone
While reports are a vital part of any business or organization, it’s important to know the different types of reports — and when to use them. With the examples above, as well as the tools you can use to create them, it’s clear that generating reports doesn’t need to be a headache. Whether you want to create long formal reports or provide a brief status update on a project, the right report can communicate what you need, when you need it.
Want to learn more?
With a project reporting workflow powered by Unito, automate reporting and save time and effort