How to Create an Effective Marketing Dashboard in GA4
Google Analytics has been the preferred analytics tool for numerous businesses over the last several years. However, the recent transition to Google Analytics 4 has led to significant confusion and potential distress among business owners, marketers, and stakeholders.
Now that the GA4 migration has happened for most of us, it’s time to start setting yourself up for reporting success with an effective marketing dashboard.
One way of doing that is ensuring your dashboards directly relate to your needs as a marketer or business owner. While Universal Analytics also had them, the marketing dashboards you’ll find in GA4 are quite different. If you haven’t migrated to GA4 from UA yet, here’s everything you need to know about switching to Google Analytics 4.
In this article:
- What is Google Analytics 4?
- Differences between UA and GA4 dashboards
- Creating a new report in GA4
- Segments in GA4
- Why you should set up GA4 dashboard
- How to set up a dashboard
- GA4 dashboard options
What is Google Analytics 4?
Before diving into setting up a digital marketing dashboard in GA4, it’s important to get to know your new Google Analytics 4 — and how it’s different from Universal Analytics. Yet, the two work the same way: they’re designed to help you track metrics to determine whether your efforts are working. GA4 works in a cross-platform way, meaning that you can track engagement on both your website and your app if you have one. If you’re looking for a more nuanced approach to data analysis, we recommend taking a look at GA4 Exploration reports
What is GA4 used for?
GA4, the latest version of Google Analytics, allows marketers to track key performance indicators (KPIs) for their websites. You can track everything from the demographics of website visitors to campaign attribution and traffic sources to the devices visitors use. With the right dashboards, marketing teams can clearly see all their marketing objectives at a glance, getting actionable insights that allow leaders to make better decisions as they build a winning marketing strategy.
The transition to Google Analytics 4
After logging into G4, you’ll immediately notice that the setup is completely different than the old UA 3. For one, there are a lot less items. Another is that everything looks like a dashboard with individual reports — and that’s intentional.
In the past, you would have to navigate to different tabs to see stats like Audience, Behavior, Traffic Analytics, etc., and click into them.
Now, like stats are grouped together in standard Dashboards under the Reports tab.
The default dashboards are Business Objectives, Life Cycle and User.
The new world of GA4 dashboards
Another major difference between GA4 and UA 3 is that in the old Universal Analytics setup, the default way of tracking was sessions. In GA4, that’s now events. And everything is an event, including:
- Page Load: Similar to a pageview in UA, but in GA4, page_view is treated as an event.
- Link Click: Any click on a link is tracked as an event.
- Link classes (from link_classes)
- Link domain (from link_domain)
- Link ID (from link_id)
- Link URL (from link_url)
- Outbound (from outbound)
- Form Fill: Interactions with forms are tracked as events.
- form_start
- form_submit
- Sale: Transactions and purchases are also events in GA4.
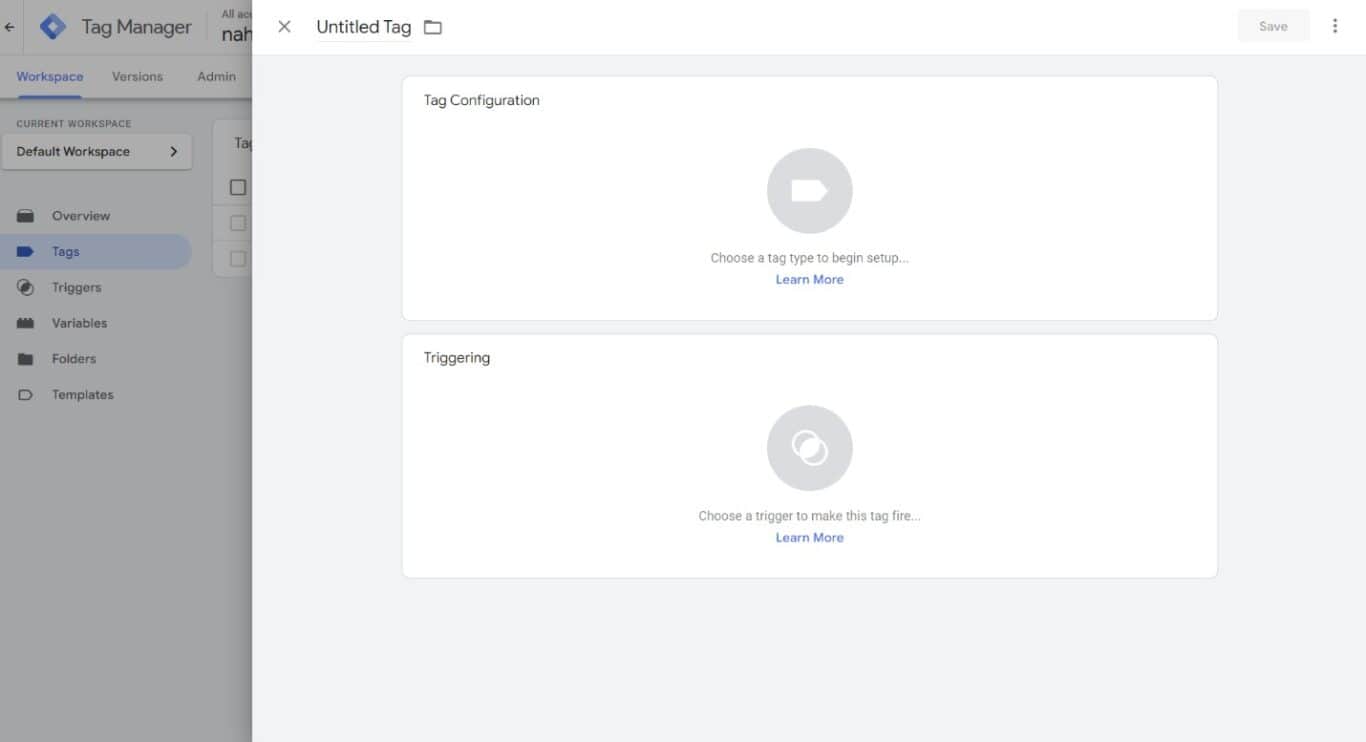
Many of these events are automatically tracked in GA4. For specialty or custom events, these should be set up in Google Tag Manager.
Machine learning leads to new insights
Another major difference between UA and GA4 is the addition of machine learning to help users anticipate user behavior, known as Predictive metrics. GA4 is the only version of Google Analytics to leverage AI and machine learning to provide you with usable data. You can use these insights to ensure that you are hitting the right target audiences.
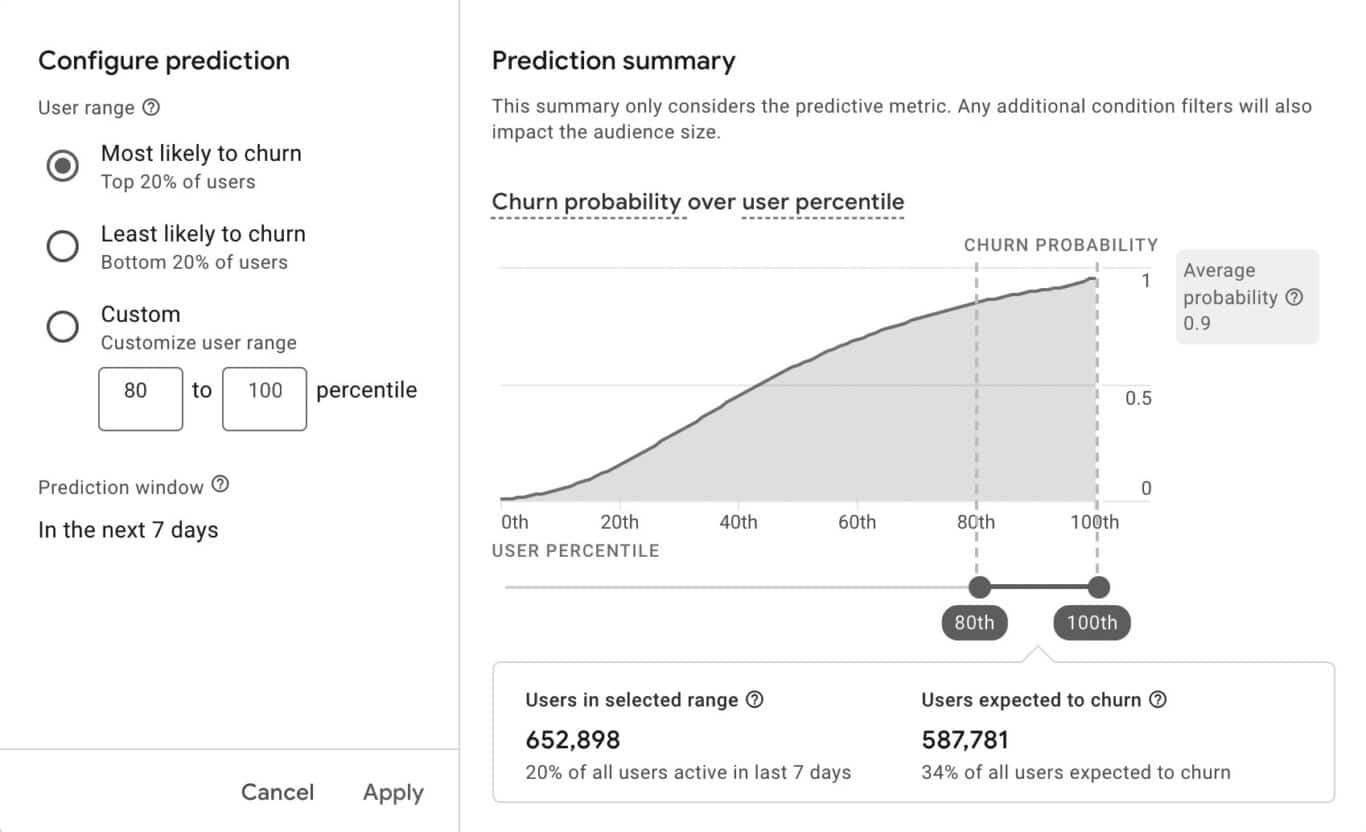
GA4 also provides you with predictions based on marketing data pulled from its machine learning. For example, it can provide you with predictions over how much revenue you can expect to make over the next month and the potential of a particular user converting.
Now, let’s take a closer look at how GA4 dashboards differ from Universal Analytics (UA).
What are the differences between a UA and GA4 dashboard?
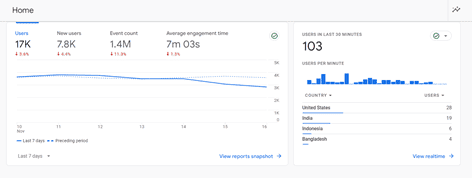
The most glaring difference from the migration to GA4 is the data collected on the main dashboard. In UA, the prominent metrics were Users, Sessions, Bounce Rate and Session Duration – again, that’s because UA was measured by sessions.
Key metrics for marketing dashboards
Now that GA4 measures by events, the most important metrics are as follows:
- Users: This is the same measurement from the UA.
- Event Count: As mentioned above, everything is an event. This metric will show the event count over the past seven days.
- New Users: Another hold-over from UA, this is all the “new” visitors to your site or app.
- Conversions: A conversion is any event that you consider valuable to your business.
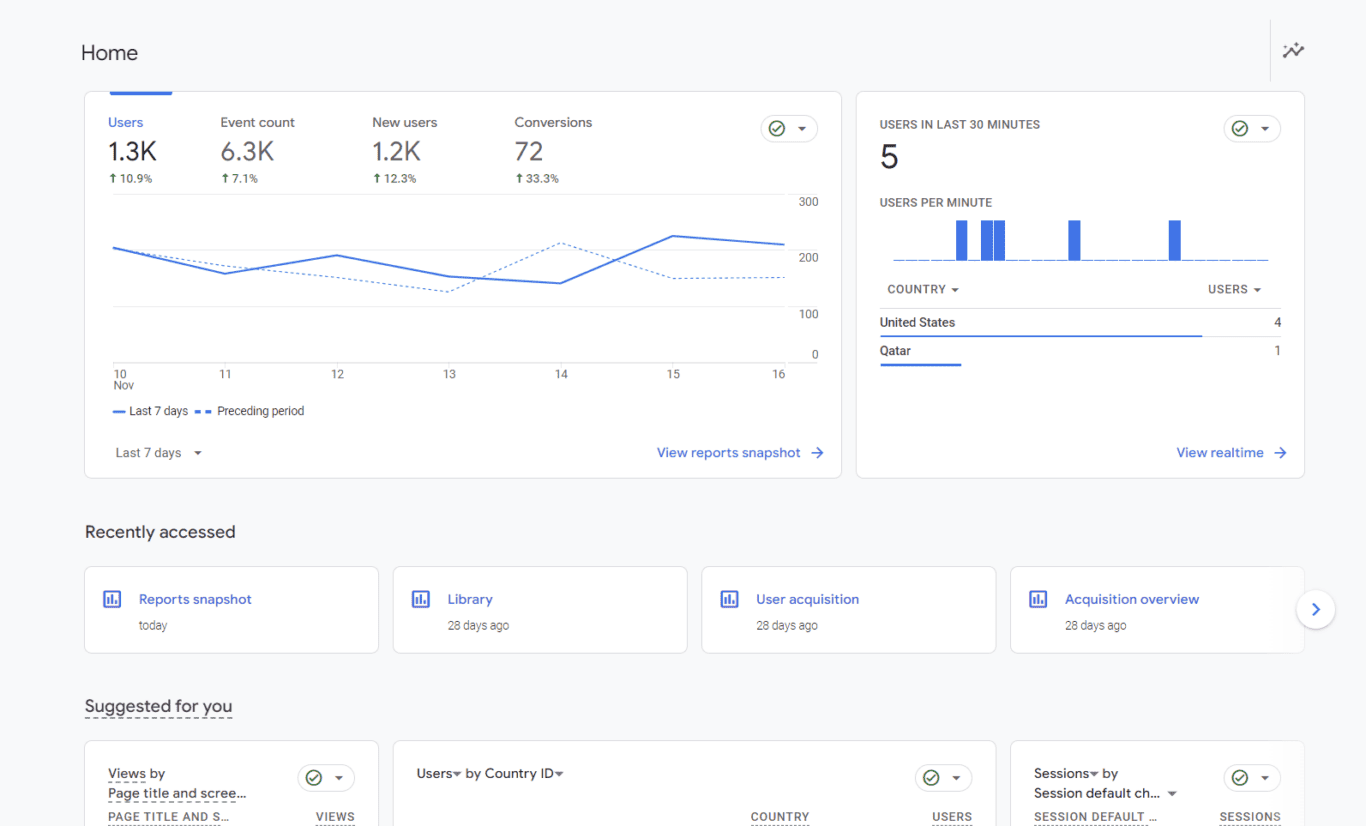
Also on this GA4 marketing dashboard, you’ll see some information like “Users in the Last 30 Minutes” and some recent or suggested reports.
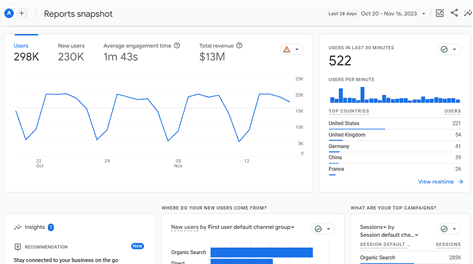
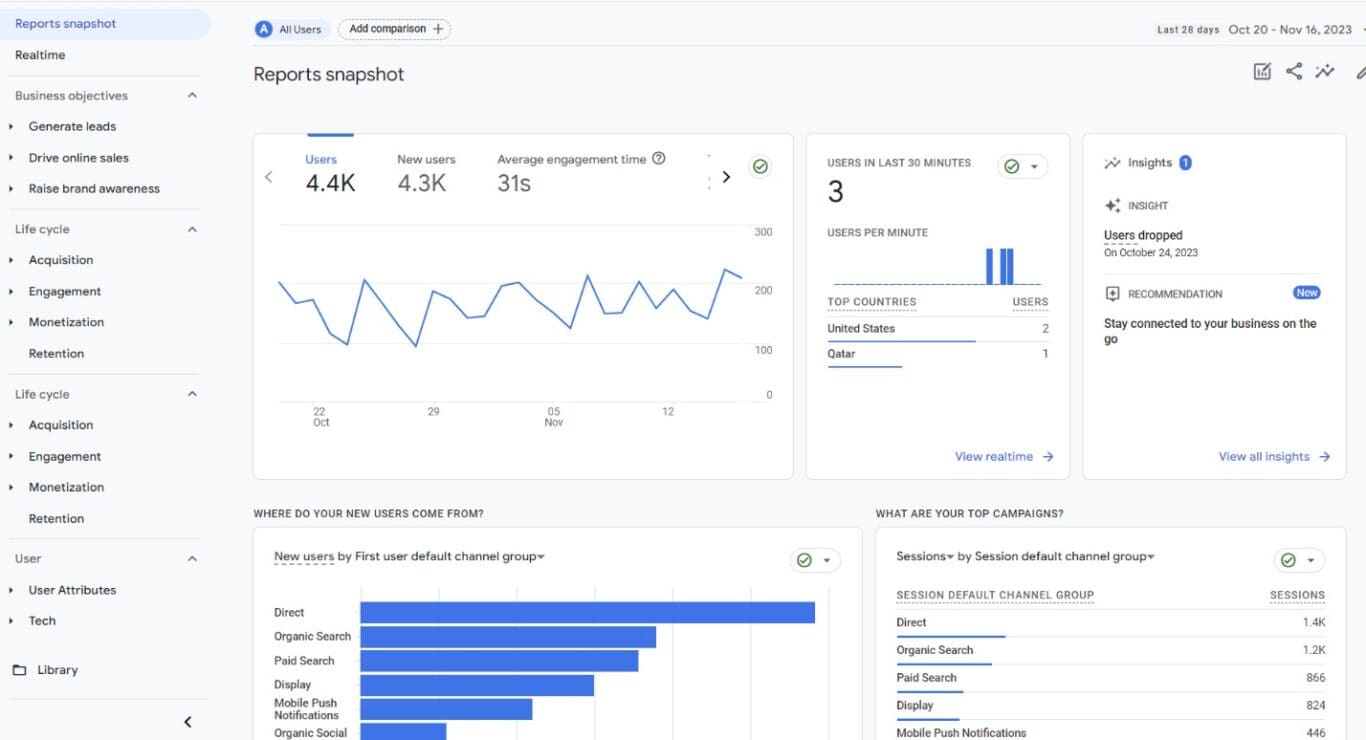
The “Reports” tab is also important. When you click on Reports, you’ll be taken to a Reports Snapshot tab.
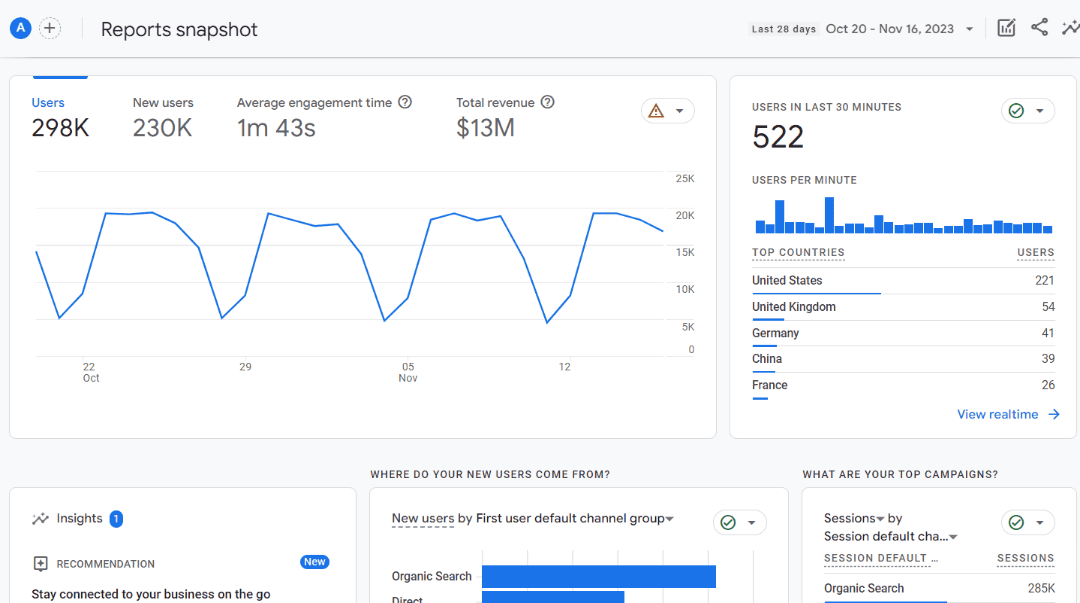
This will give a quick view at your metrics. You can dive further into these metrics by clicking on the “View X” under each card.
On the left, under the main GA4 “Reports” tab, you’ll also see the groups of reports that have been made into Collections.
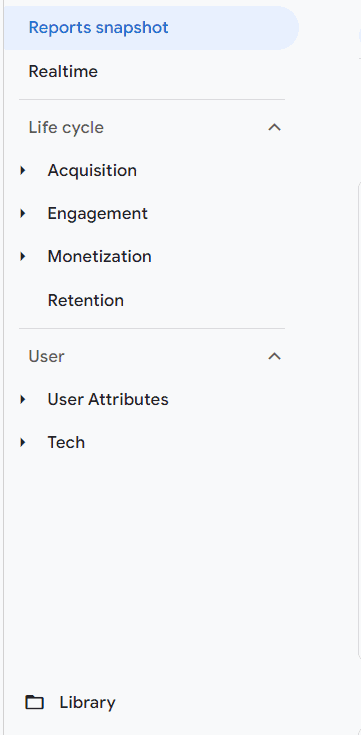
You can edit these GA4 Collections in the Library or even create brand-new reports and collections.
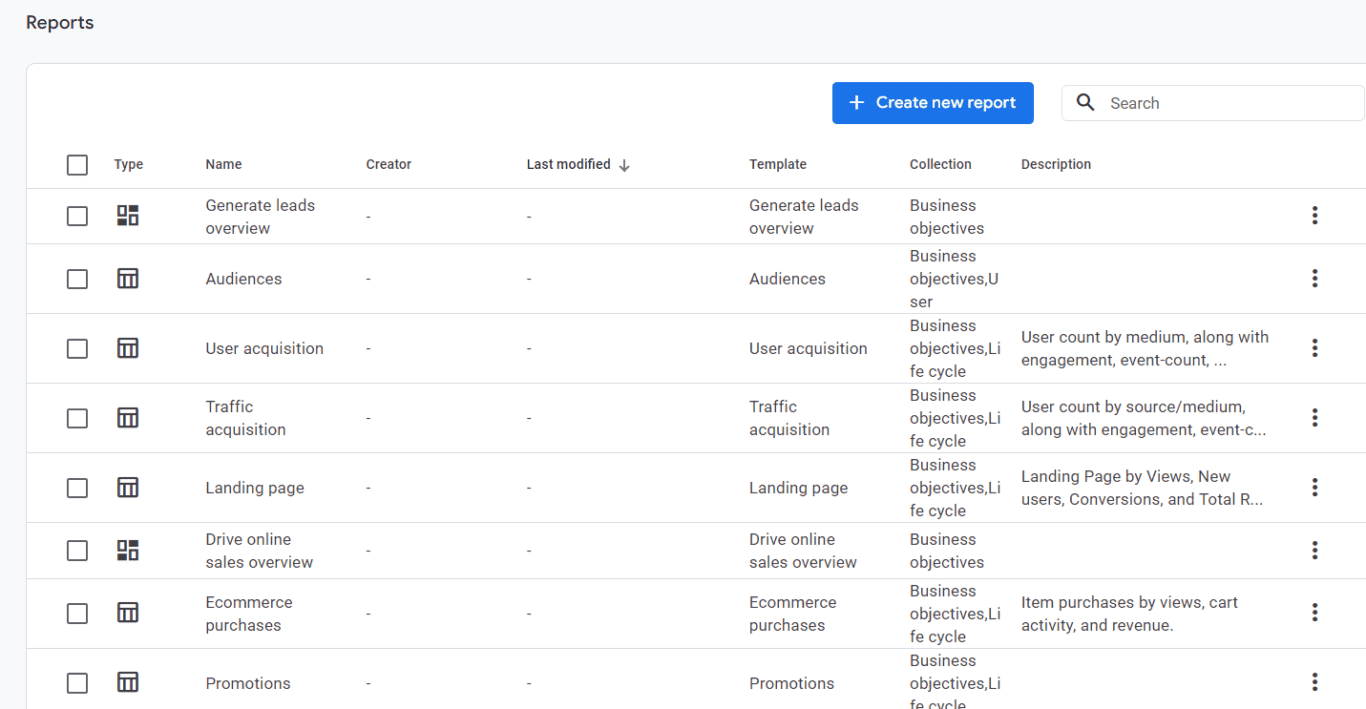
Creating a new marketing report in GA4
To create a new report in Google Analytics 4, you can:
- Create one from scratch.
- Create one from a template.
- Duplicate and existing report and edit it to fit your needs. (Do this by clicking into an existing report, doing your edits, and saving it with a new name.)
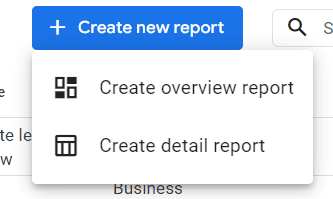
You also have two options for your reports:
- Overview Report: This typically creates a summary of the data about a single topic.
- Detail Report: Unlike a high-level overview, this would be an analytical report that typically includes charts and tables. In short, these are the reports that would be included in the Overview Report.
You have a few presets for Overview reports, but most people need more data than that.
Creating segments in Google Analytics 4
A key step to building an effective marketing dashboard in GA4 is setting up specific audience segments. Segments allow you to dissect your data, providing a granular look at specific subsets of users. Whether you’re separating first-time visitors from returning customers, or viewers from different geographical locations, segments offer valuable insights into user behavior.
What makes GA4 segments indispensable?
- Personalization: Tailor your marketing strategies by understanding the unique behavior patterns within each segment.
- Performance Measurement: Gauge the effectiveness of your campaigns by segmenting users based on their acquisition source.
- Better Insights: Go beyond the surface data to uncover deeper trends and correlations that can drive your marketing decisions.
Read our in-depth guide to setting up segments quickly in GA4 to enhance your marketing reporting efforts and better understand your audience on a more granular level.
Why You Should Set Up a Custom GA4 Dashboard
While the default reports are pretty comprehensive, they can be lacking if you’re trying to track specific items. For example, if your organization has multiple business units, they might want to only see reports related to their activity.
While you can constantly filter out data from the main reports, you could also create filtered reports, group them into a single Collection, and then display that collection as a dashboard on the main screen.
This makes reporting easier for what’s most interesting to you or individual stakeholders.
How to Set Up a GA4 Dashboard
To set up your custom GA4 dashboard, first start by creating your custom report by clicking “Create detail report”. We recommend using one of the templates and adding filters since it’s much easier than trying to create a blank report.
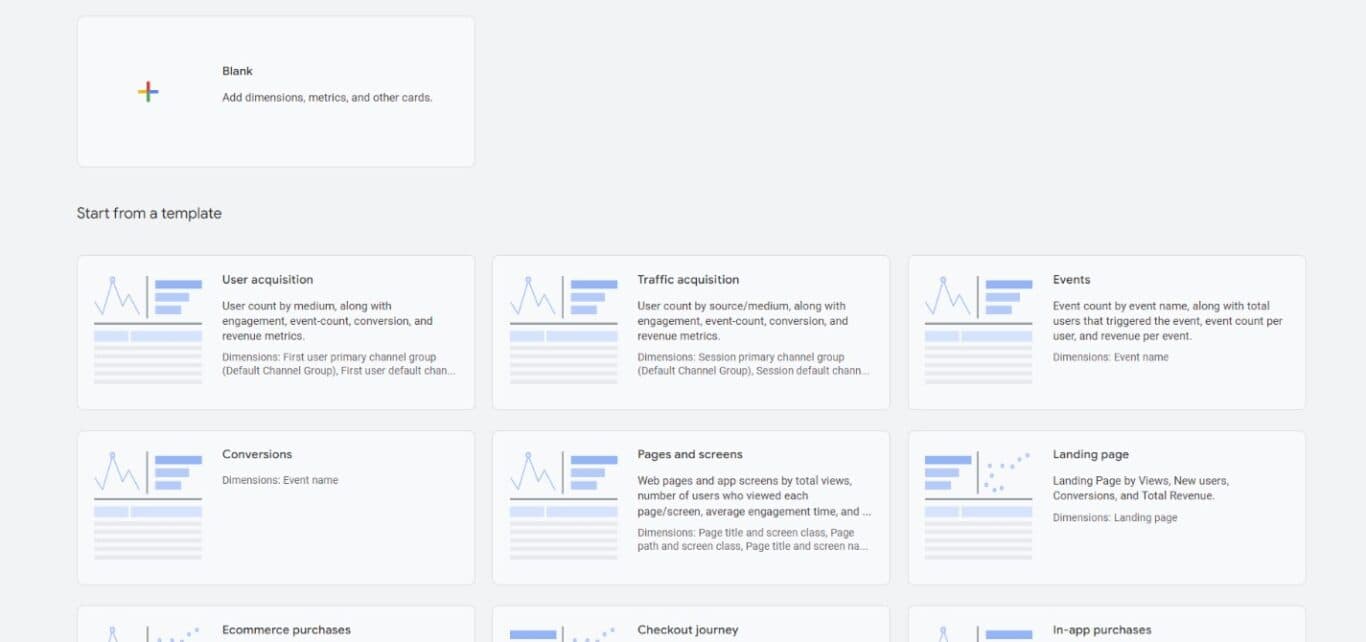
You’ll then be taken to a screen where you can add Dimensions, Metrics, Filters, etc.
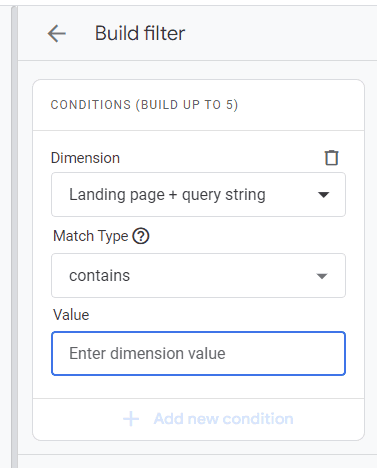
Once you select your metrics and dimensions, you can create a filter. For example, if a stakeholder only cares about data coming from certain landing pages, you can add a landing page filter and only have the report show data coming from specific pages.
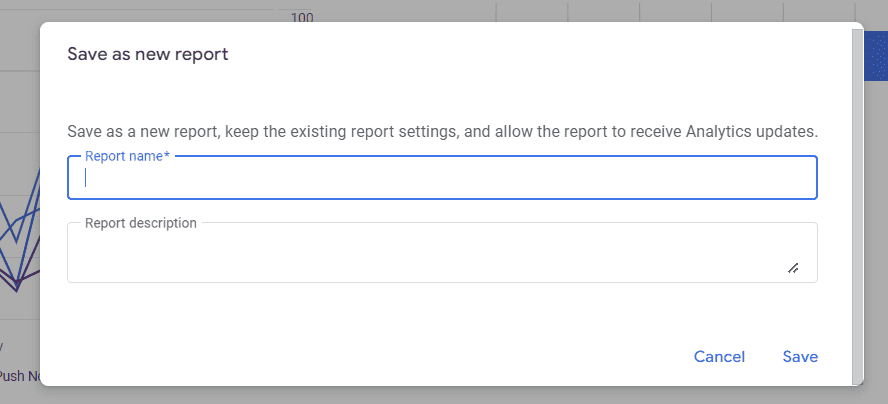
Once you create your report, give it a unique name. You can even add a description to ensure that you distinguish it from other reports.
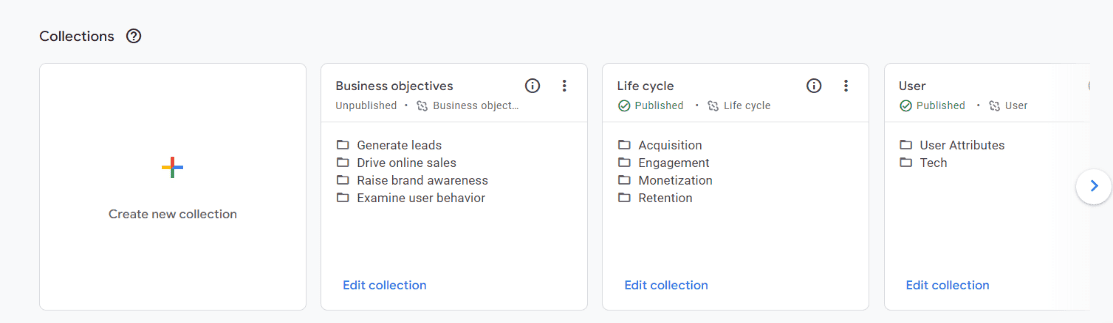
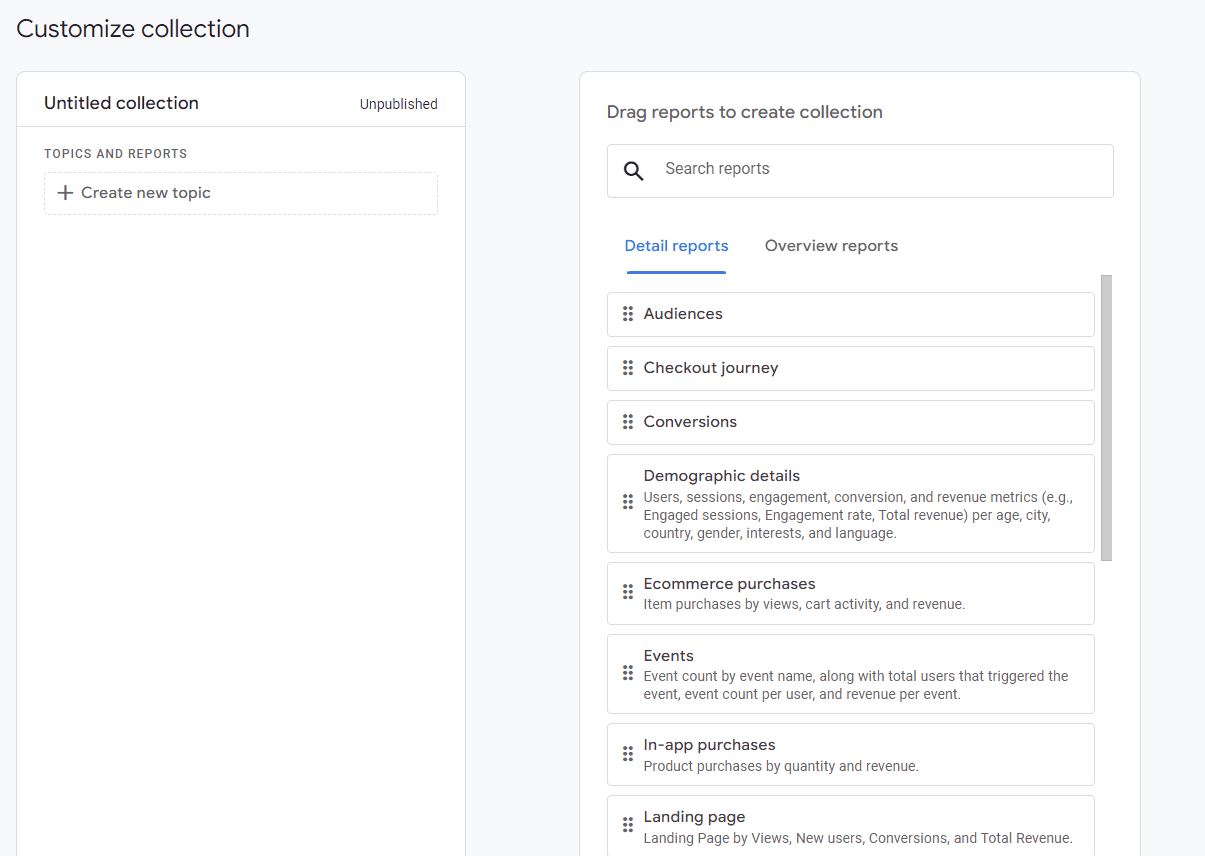
You can add reports to existing or new collections. To add it to a new collection, click “Create new collection” and then click “Blank”.
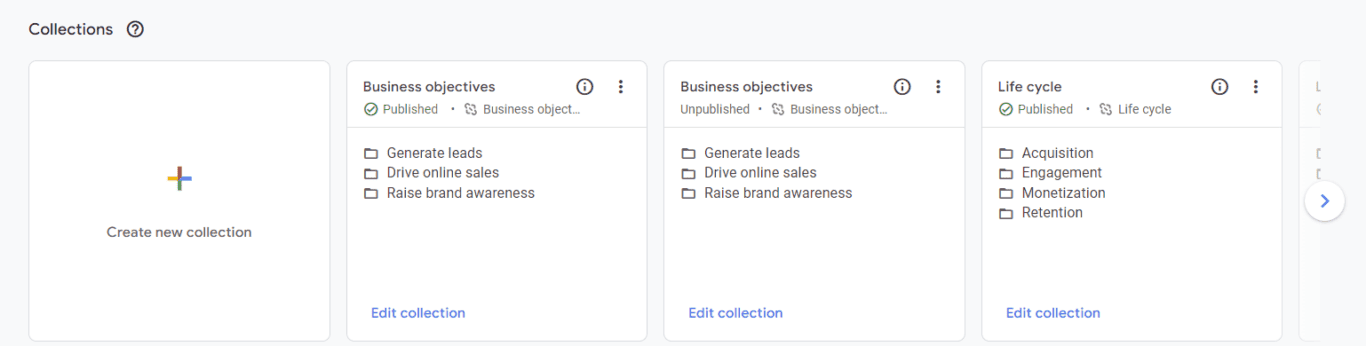
From there, you can give your Collection a name and drag either Detail or Overview reports over to add to the Collection.
Once you save and publish your Collection, it will show up as a Dashboard on your main Report screen. These groups of reports will essentially be your new custom dashboard.
Now that you know how to create custom dashboards, you might be wondering which ones should you create? Well, we can help you with that, too.
Don’t want to start from scratch? Check out one of our marketing dashboard templates for GA4 and Google Sheets here.
Which GA4 Dashboard Should You Create?
Digital Marketing Efforts Dashboard
More than likely, if you have a marketing team, then they’re running different campaigns. You can create campaign specific boards or wider digital marketing campaign tracking using filters.
If you’re running any type of Google campaign, for example a Google Ads remarketing campaign, you can simply filter by the name of the campaign – as long as GA and Google Ads is connected. If you’ve set up UTM codes because you’re running campaigns on different platforms, say Google Ads, Facebook and Instagram, then you can filter by the campaign name.
Note: when setting up your UTMs, be sure to use a campaign code or name in common to ensure that you can pull them into a single dashboard.
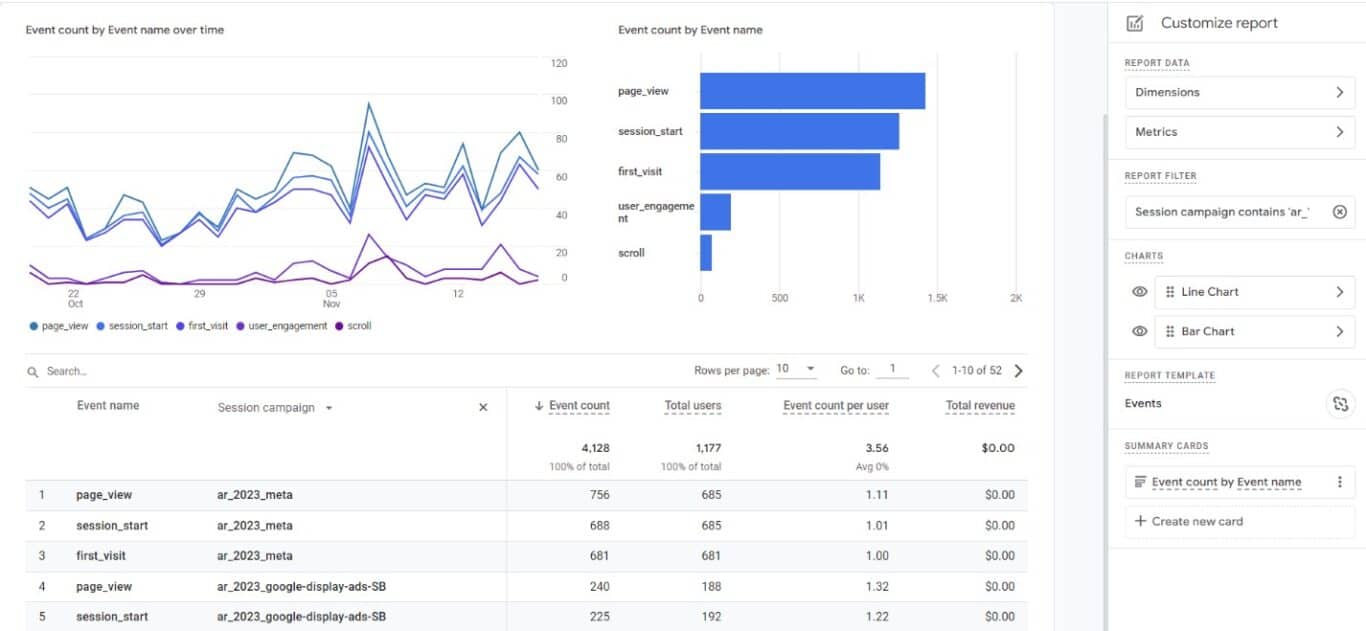
Tip: Since paid search campaigns usually use a last-click attribution model, filtering by “Session Campaign” (the campaign of the session in which the conversion happened) rather than “User Campaign” (the first ever session of the user who later has converted) will provide results which are most aligned with your ad account.
You can then group together the different advertising campaigns to create a Collection.
Sales Dashboard
While tracking all conversions can be great, you may want to focus on just your moneymakers. In that case, you could set up an Ecommerce Purchase report. You can filter these by Item Name or Item ID.
This report will show you data like cart activity, revenue and the item purchased. You can track if key products are moving.
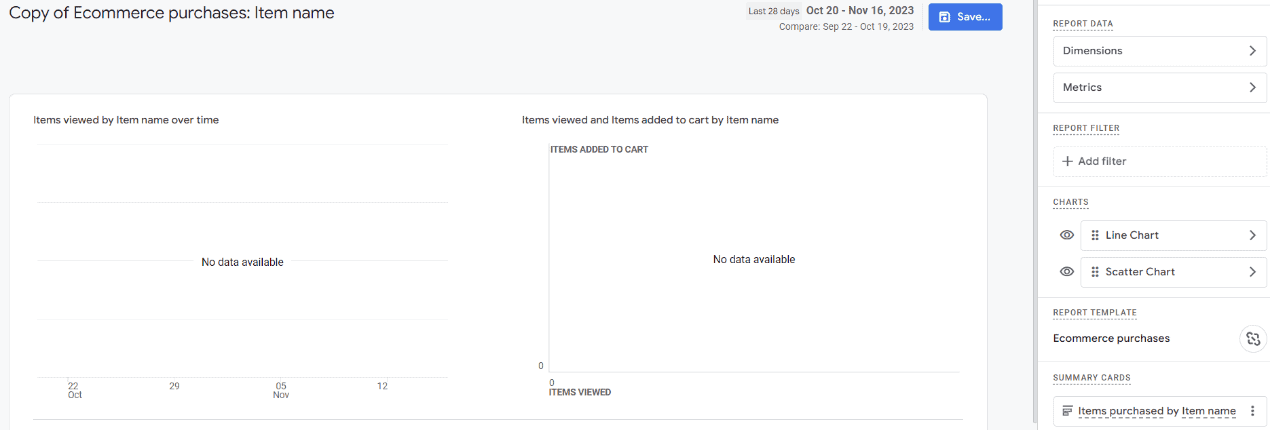
If there are multiple products to track, name each report as the product and then group them into a Collection.
Here are more sales reporting templates for the other tools in your stack, including Airtable, Microsoft Excel, Google Sheets, HubSpot and others.
Landing Page
While your whole site is important, you may not want to know the bounce rate, conversions, views, and users on every page. Creating a detail landing page report can provide you with specific data about important pages, including your transactional or eCommerce pages.
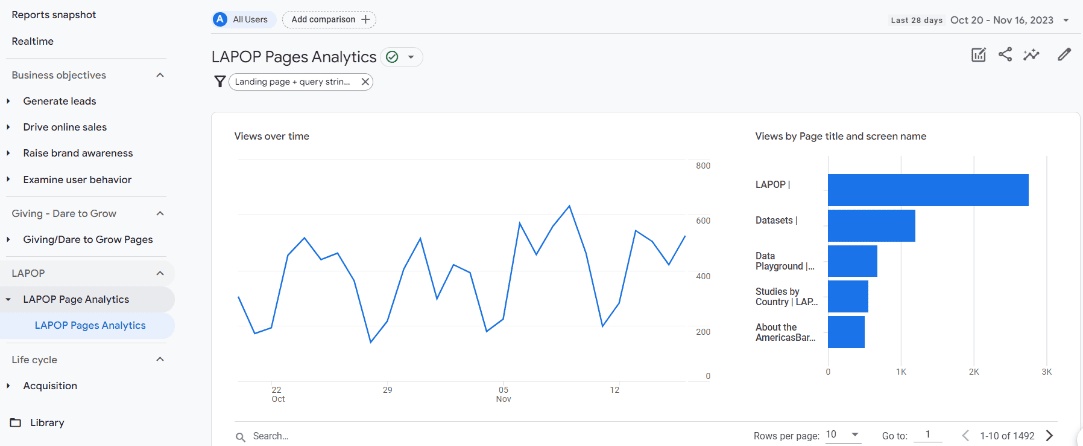
In the above example, a university has different schools on the campus. So, the marketers wanted to create landing page reports on the sections of the site relative to each school. So, each school or organization only receives landing page data relevant to its needs.
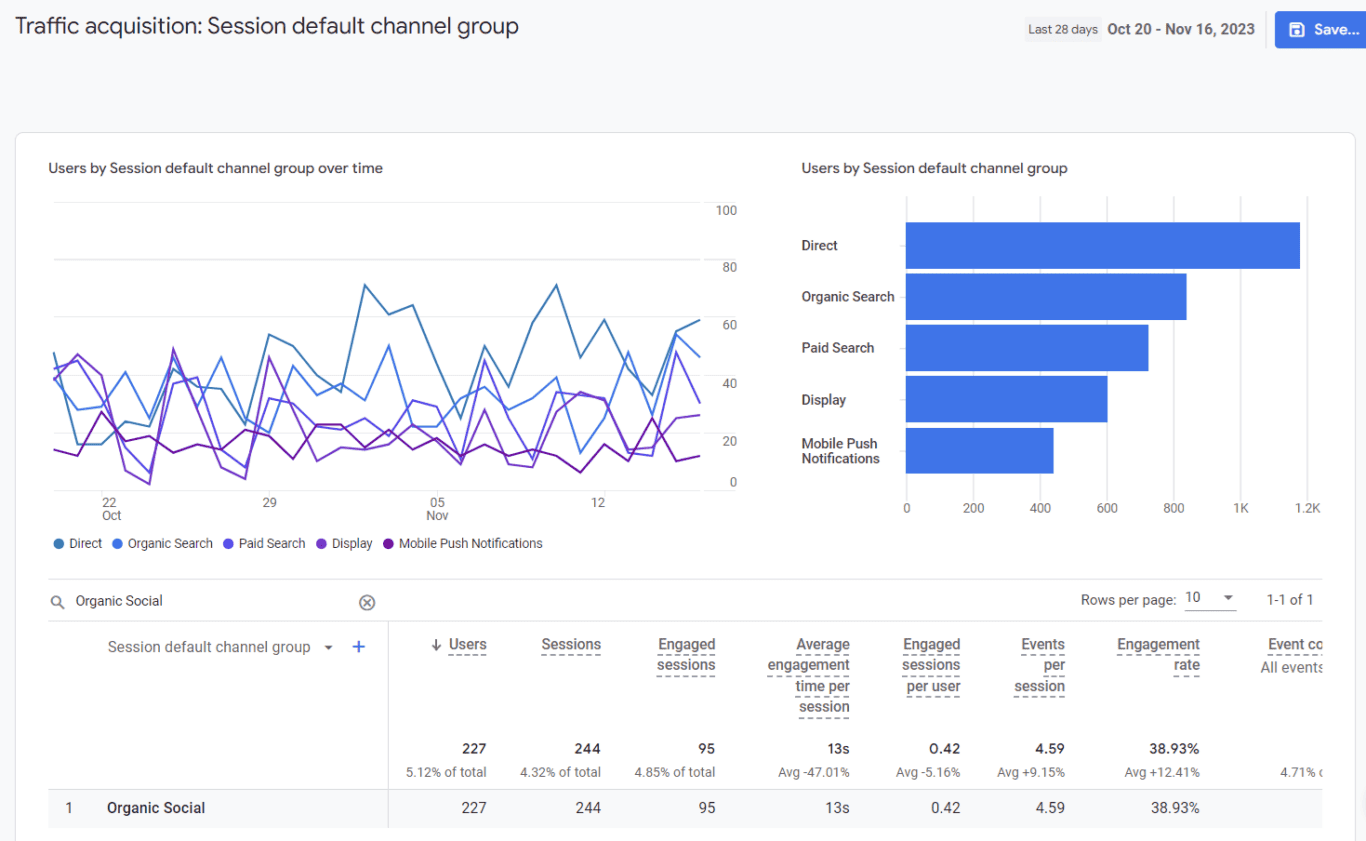
Social Media Dashboard
Content marketing is a major portion of any digital marketing effort. Oftentimes, social media is a major focus of stakeholders. You can create a social media Collection that encompasses both Organic and Paid Social.
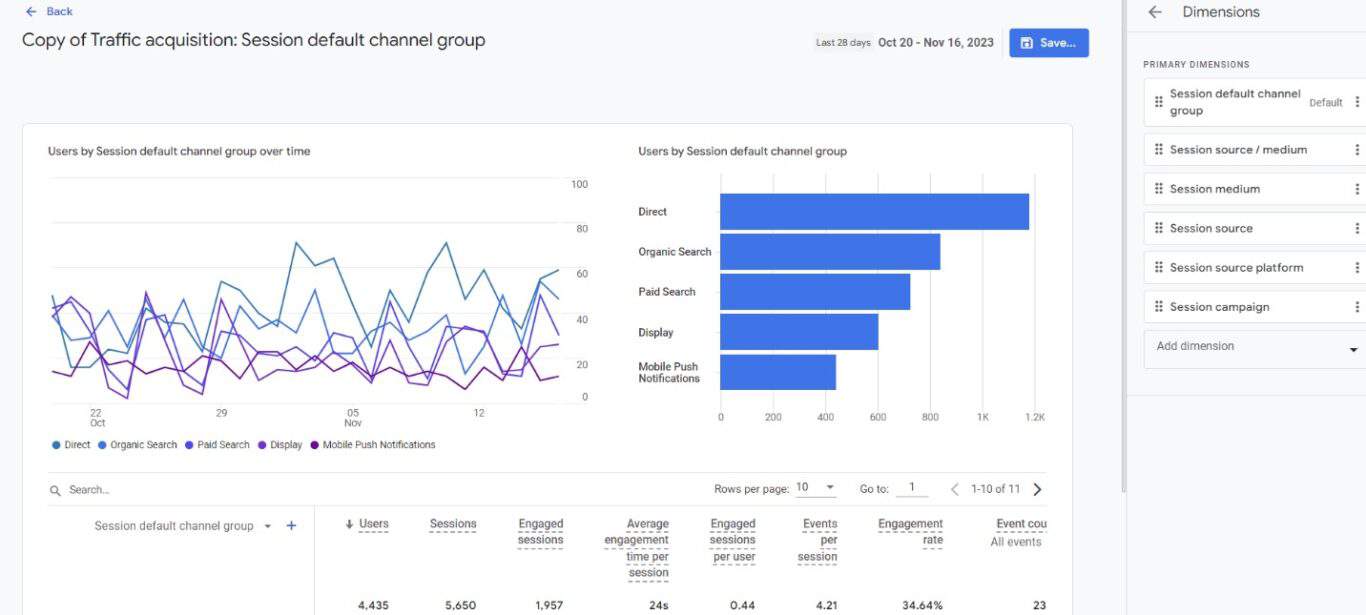
To create this type of report, create a Traffic Acquisition report. Then, add a filter so that the Session Default Group is Organic Social for one report and Paid Social for another. Then, save the reports and add them to a Collection.
If you’re working in Facebook Audience Insights, here’s a similar guide to effective marketing dashboards.
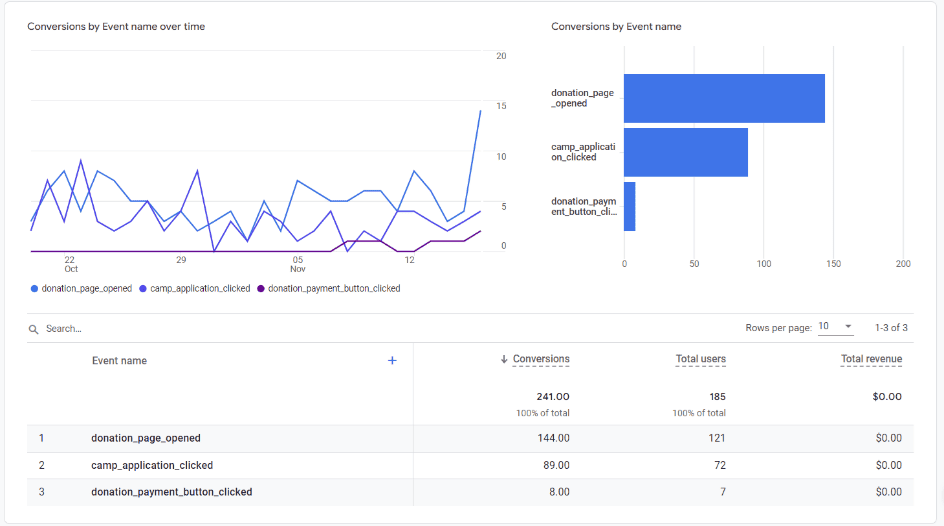
Conversion Report
The existing conversions report will show you all your current conversions. But you can make this even more meaningful by breaking them into types of conversions. For example, you could have three tiers: top, middle, and bottom of the funnel.
Your conversions are always weighted, and some are more important than others. Add filters to your reports to show only the conversions for each portion of the funnel. Create three different reports, and then add to a “Conversions” Collection.
Predictive Analytics in GA4
At Unito, we’re all about helping you streamline your workflow and make data-driven decisions. That’s why we’re excited about Google Analytics 4 (GA4)’s predictive analytics capabilities. Through the magic of machine learning, GA4 can forecast future customer behavior by analyzing historical data, offering invaluable insights for your marketing strategies. You can identify audiences who are likely to convert, enriching your data and empowering you to make smarter, more informed decisions. It’s like having a crystal ball for your digital marketing!
Unito’s Google Analytics 4 connector is now live!
Now it’s time to quickly create insightful GA4 marketing reports that you can share with stakeholders and coworkers! Unito’s Google Analytics 4 connector lets you sync data from any GA4 marketing dashboard to other tools (though we recommend a spreadsheet such as Google Sheets or Microsoft Excel).
Follow along with our step-by-step guide to set up your own GA4 integration here.
With the combination of the data collected by GA4 and being able to effectively leverage these insights with Unito, your reports will become more meaningful and easier to create. Here’s how it works:
FAQ: GA4 Dashboard
Can you make dashboards in GA4?
Absolutely! GA4 allows marketers to build dashboards that track important marketing metrics like audience demographics, campaign performance metrics, and more. This allows leaders to see how their strategy is contributing to the overall business.
What is the difference between UA and GA4?
Universal Analytics is the outdated, historical version of GA4. As of July 1st, 2024, users don’t have access to new data in Universal Analytics. Some old data might still be accessible, but it will eventually be deleted by Google. GA4 is the newest version, and marketers who aren’t yet using it should plan their migration soon.
What’s the difference between GA4 and Google Search Console?
GA4 can give you an overall view of multiple properties (like multiple websites) while Google Search Console only allows you to connect one domain. That makes Google Search Console a great tool for drilling down into organic search results and other performance metrics for a website while GA4 is better suited to getting an overall view of your marketing initiatives.