
Google Analytics Insights and How to Use Them
Google Analytics has evolved to become more useful to marketers, business owners, and stakeholders. It tries to provide insights that can help you better refine your marketing efforts and better understand your metrics. One way it does this is via Google Analytics Insights, helpful tips that can make your GA4 metrics more actionable.
Insights are more than data points; they’re a roadmap to improved website performance and tailored business strategies. Below you’ll find out how these insights will help you gain knowledge and a competitive edge, with practical tips on leveraging both automated and custom data analysis through GA4.
Key Takeaways
- Google Analytics Insights (GA4) provides both automated insights, powered by machine learning for anomaly detection and trend analysis, and custom insights.
- The GA4 interface allows users to access, create, and manage insights, with options to set up email notifications for custom insights, ensuring pertinent data changes and trends are promptly communicated to users.
- Custom insights and charts provide more detail for monitoring of KPIs and metrics, enabling businesses to leverage data for long term trend change detection.
In this article:
- Understanding Google Analytics insights
- Types of GA4 Insights and where to find them
- Examples of insights in GA4
- How to create custom insights in GA4
- How to connect insights to business strategy
- What are the implications of trend changes?
- Streamline insights and marketing reports with Unito’s GA4 connector
- Frequently Asked Questions: Trend Changes and GA4 Insights
Understanding Google Analytics insights
The purpose of Google Analytics is to help you improve the tracking and understanding your marketing campaigns. It shows everything from direct and organic search traffic in a chart, to display and email results. But none of this means anything if you’re not able to gain insights into the effectiveness of all your marketing drives. This is where Google Analytics Insights can help.
GA4’s Analytics Insights leverage both your configured conditions and machine learning to provide in-depth analysis of your data. You can then use these insights to better understand and tweak your campaigns week over week.
The role of machine learning in automated insights
Google Analytics 4 employs a sophisticated machine learning algorithm to tirelessly search through extensive datasets to determine if there’s a new trend or unusual changes. This constant search analysis is the foundation upon which automated insights are built.
Week by week, Google Analytics 4’s machine learning algorithm refines its delivery of automated insights by employing artificial intelligence honed by direct user interactions such as feedback on preferences—likes or dislikes—thus continually refining its search recommendations.
Impact through custom insights
Custom insights shine a light on the key metrics and objectives crucial to your business, offering an invaluable benefit. These tailored insights ensure that analysis of data is consistently pertinent to your company’s aims by aligning with your distinct business targets.
Monitoring relevant data paves the way for generating targeted insight specifically designed to meet the needs of your organization. Concentrating on significant data allows companies to gauge their advancement towards objectives effectively and base strategic decisions on well-informed analyses.
Types of Google Analytics insights
There are two options for Google Analytics Insights: automated and custom.
Automated insights: This type – as the name implies – provides you with automated insights based on trends or unusual activity within your data.
Custom insights: This lets you to set up conditions (up to 50) that allow you to detect changes that are relevant to your business or campaigns. As these are triggered, the insights will be available on the Insights dashboard. You can also set up email alerts.
Where to find insights in GA4
When you venture down on the sidebar of the GA4 Home page, you will encounter a specific area labeled “Insights and recommendations.” Within this space, your personal Custom Insight card(s) will be displayed.
Go to either the GA4 Home page, the Advertising page, or the Reports snapshot page.
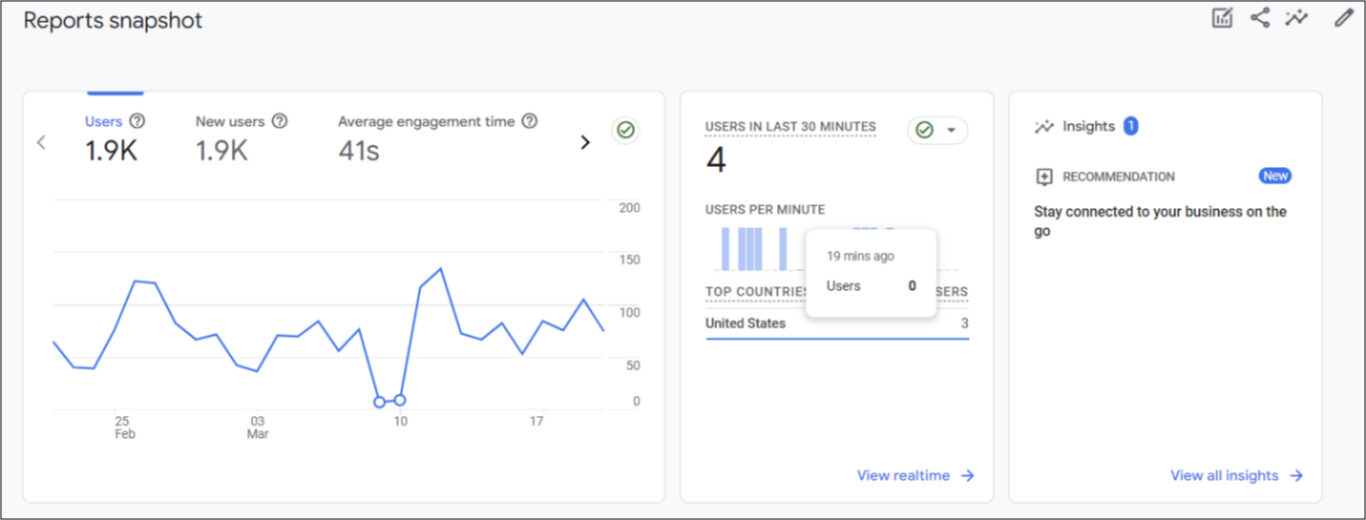
Both Advertising snapshot pages and Reports provide insight cards that pertain to an overview of data metrics and performance statistics related to advertising campaigns.
Just scroll over to the right. They’re located in the last box called: “Insights”.
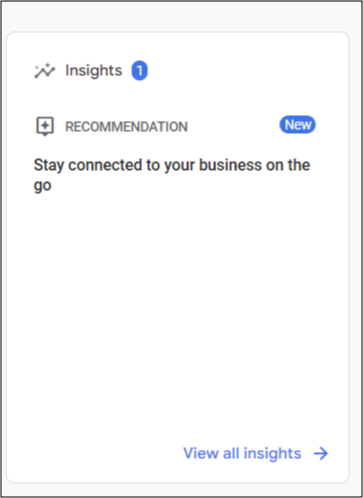
But this usually only gives you one or two insights, and you’re likely to want more than that!
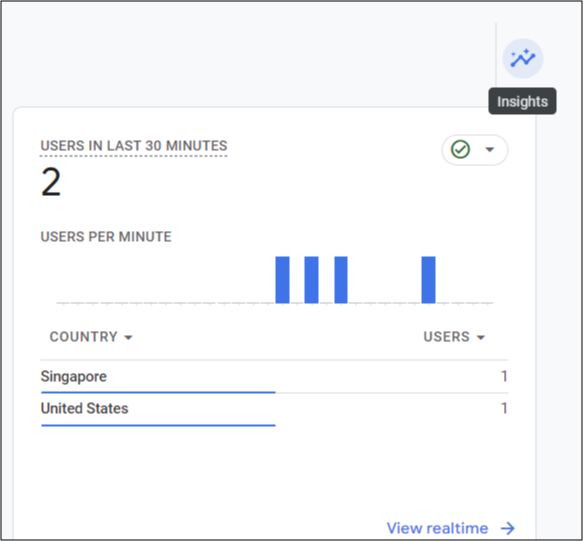
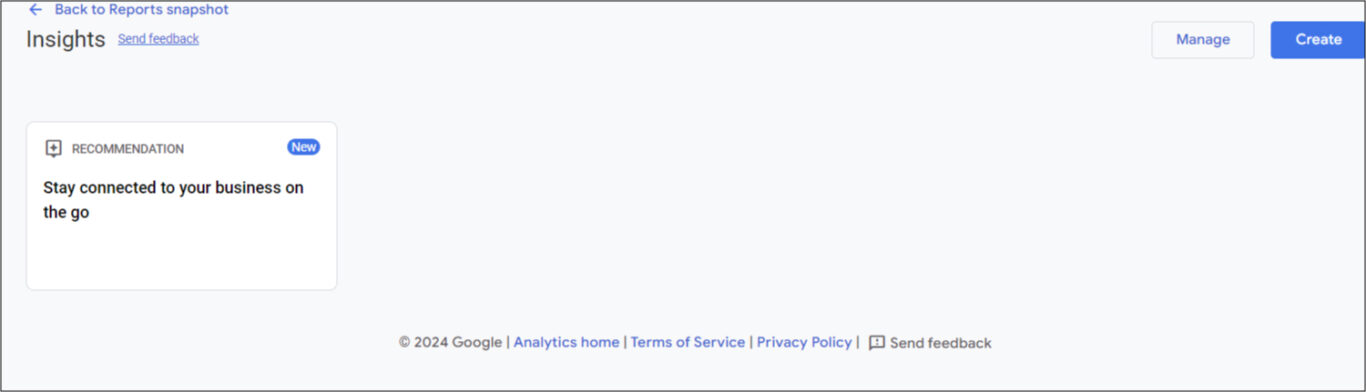
To view the rest of the insights, click on the trend line with the stars. This will launch the Insights hub screen. It’s located in the upper right corner of the page along with the Edit Comparisons, Share, and Customize report icons.
You can also click on the “View all insights” at the bottom of the card to open the Insights screen.

This is how the Insights screen will look. It’s also where you can create Custom insights.
Examples of GA4 insights
For full oversight and modification capabilities of your custom insight inventory, select ‘View all insights’ located on the Advertising snapshot page or simply visit the Insights dashboard directly.
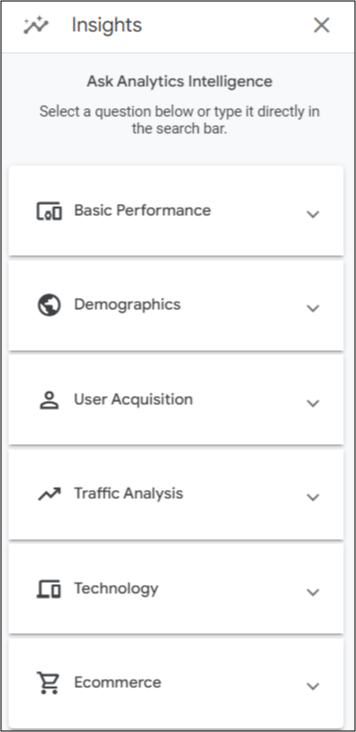
After you click on the Insights icon, the available custom insights will show up on the right-hand side of the screen. There are a few types of insights:
- Basic Performance (which is overview of your performance metrics)
- Demographics
- User Acquisition
- Traffic Analysis
- Technology (devices, browser, etc.)
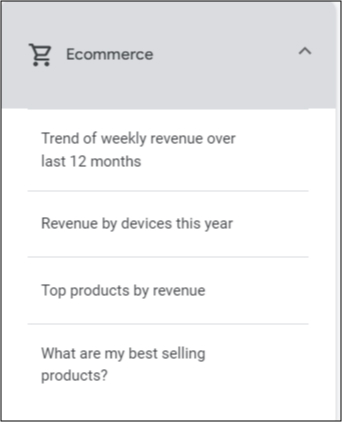
- Ecommerce
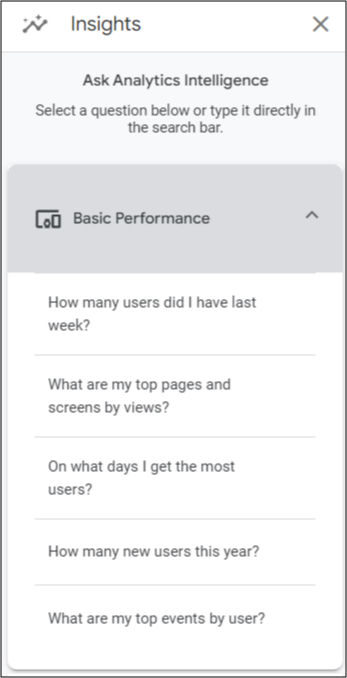
Underneath each of you will either see questions (i.e. how many users did I have last week) or statements about trends or stats (i.e. month over month growth in users).
Perhaps, you only want a general overview of how your campaigns are doing? You could click the “Basic” tab and obtain data on user trends, top pages, and which days perform the best.
You can use each of these sections to learn more about how your stats are doing or to learn more about your users and/or campaigns.
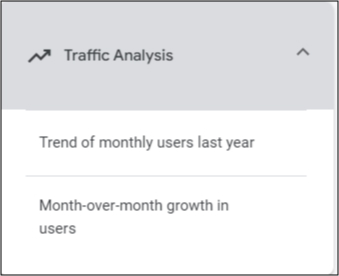
For example, if you want to drill down even further into your users, you can leverage the Traffic Analysis section to learn about trends in your user activity.
The Ecommerce section will be solely for your paid activities. (If you are running paid campaigns, it would be a good idea to set up custom metrics for it to monitor increases or decreases in purchases or other conversions.)
The purpose of these insights is to help you monitor major changes in your data that could have long-lasting effects on your performance. It’s similar to anomaly detection, except over the long-term. Anomaly detection will only show spikes in recent data. Trend change detection will allow you to see how your data has been affected over periods of time.
How to create custom insights in GA4
If none of the automatic insights work for you, you can create your own custom insights.
On the Insights screen, click Create. This will open the below screen.
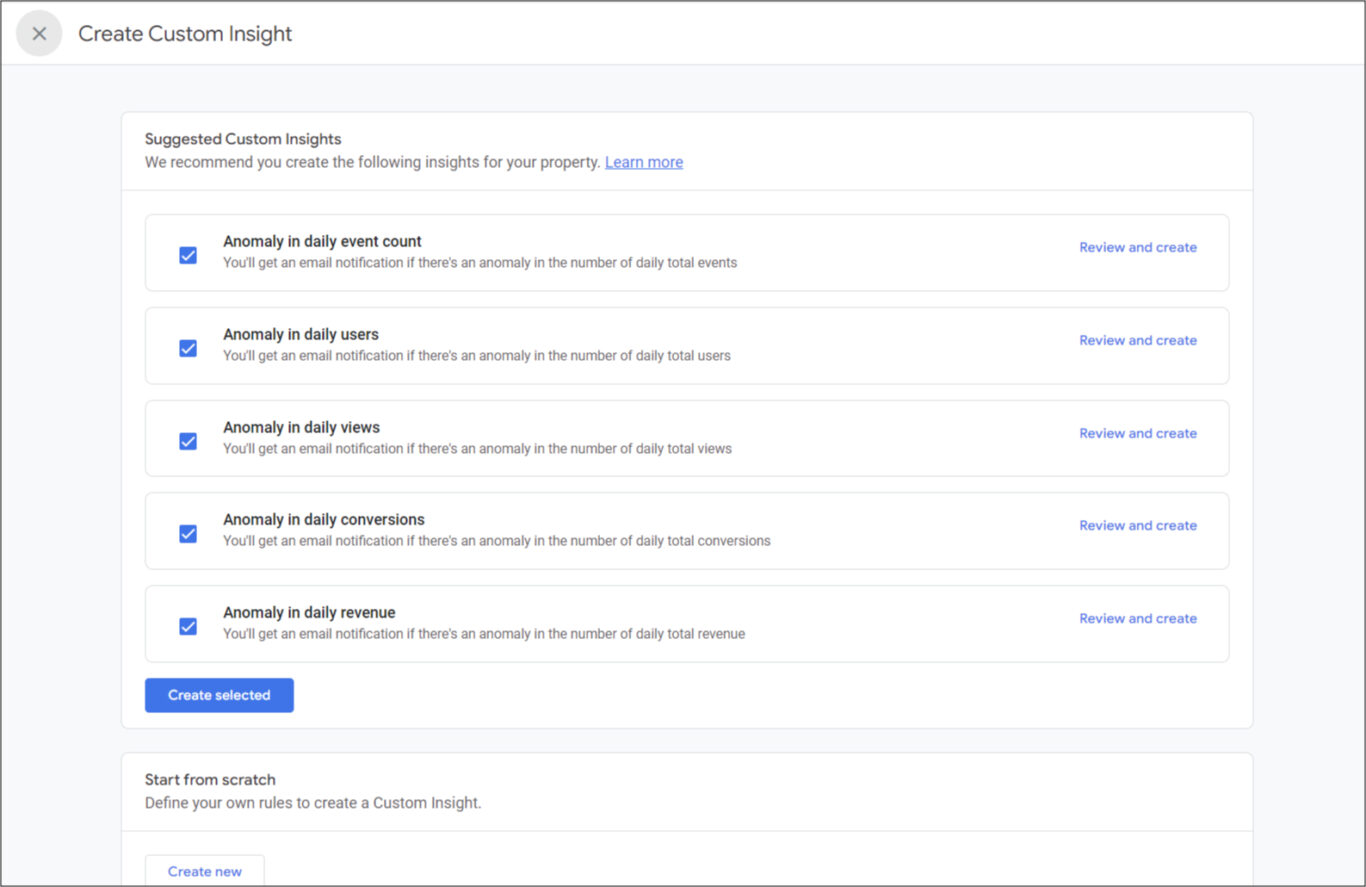
You can choose from existing anomaly detections or create your own. To use one of the recommended insights, click the checkbox next to it.
From there, select Review and create. This screen will appear.
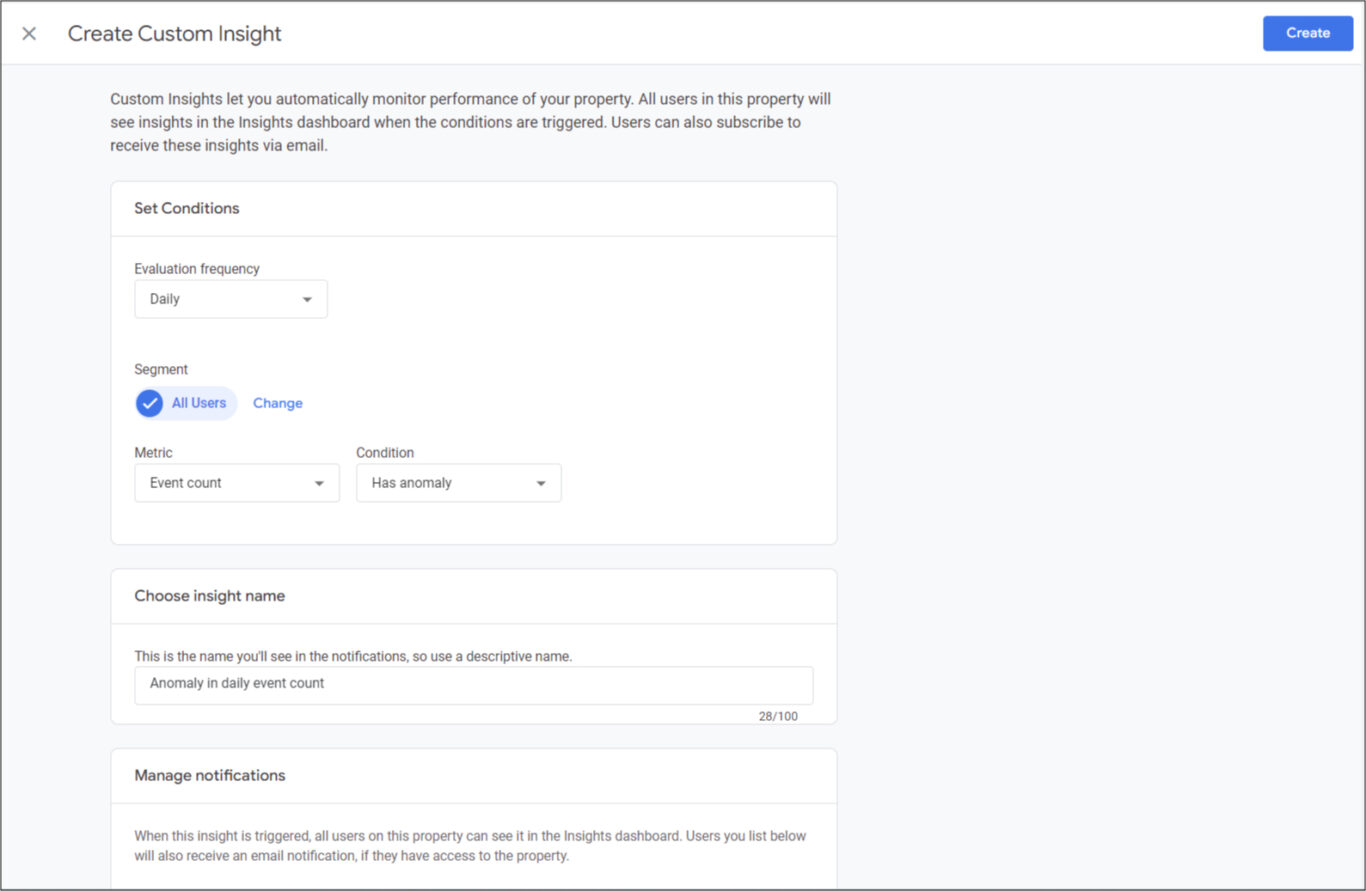
Set your conditions
- Evaluation frequency: This is how often the data should be checked for the anomaly: hourly, daily, weekly, or monthly.
- Segment: Should this affect all users or only some? You can indicate whether you want to include or exclude certain audiences.
- Metric: This is where you set the threshold for the anomaly that will trigger the insight. These could be, for example, increases or decreases in users over a weekly period, or decrease in conversions.
As mentioned, Custom insights will show up in the Dashboard, but you can also be notified via email.
Once done, hit Create – and that’s it!
Setting up email notifications for insights
Google Analytics 4enables you to manage email notifications for custom insights. Go to your list of custom insights and click ‘Manage’ to toggle Email Notifications on or off.
You can also set up personalized alerts, including frequency—be it daily, weekly or monthly—based on specific data views within your reports.
How to connect insights to business strategy
Putting your focus on the market and looking for relevant details with GA4 Insights can provide a significant advantage to your business as you look to the future.
Leverage your insights in market analysis
The ‘Geo’ report offers valuable information about where in the world website visitors are coming from, assisting in pinpointing new potential markets for targeted strategic efforts.
By breaking down audiences into specific demographics and interests, you can form pertinent categories that improve comprehension of how interested segments interact within the market. Over the course of your experimentation with GA4 Insights, be sure to explore values such as:
The process of strategic planning and targeting marketing campaigns gains sophistication with detailed analyses based on traffic sources and user engagement patterns provided by Google Analytics data.
Identify growth opportunities
Combine GA4 insights with market research to uncover gaps in your current offering or untapped markets. Are there high-performing countries you haven’t focused on? Specific audience segments with surprising engagement levels? Insights can spotlight these potential areas for expansion.
Map your customer journey
GA4 Behavior data can reveal how customers navigate your site, find products, and convert. Map this journey, then examine it for friction points or drop-off areas that insights might illuminate. Strategize improvements to boost conversions. This can be done through GA4 explorations.
Validate your content strategy
Deepen your analysis of top-performing content with insights. Did a recent blog post generate unexpected traffic? Was a technical white paper or new eBook primarily popular with a niche audience? These insights help refine your content strategy for greater impact.
Conduct frequent competitor analyses
While GA4 doesn’t directly track competitors, its audience data can unveil valuable information. Are you drawing in similar demographics or are there unique audience segments to target? Compare insights to highlight potential differentiation strategies.
What are the implications of trend changes?
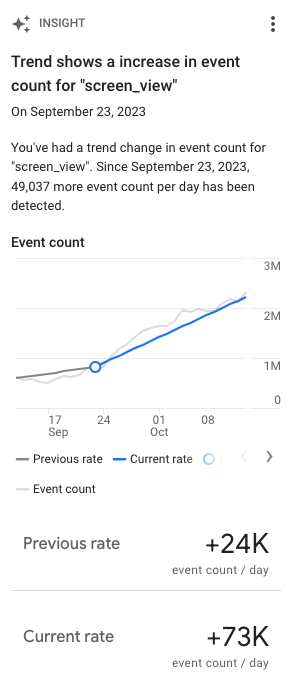
Looking at trend shifts with GA4 is vital for informing the details of your marketing report with knowledge derived from data. The platform employs a sophisticated machine learning algorithm known as average convergence divergence. This algorithm helps manage data through moving average convergence divergence technique, to pinpoint trend alterations over time series data. Suggestions can then be presented and acted upon based on key details in your reports.
Through an examination of any line graph representing either roughly 90 days’ worth of daily data or about 32 weeks’ worth of weekly data, you can more clearly observe both incremental and long-term adjustments in trends via moving averages.
The detection mechanism for a trend change helps you keep an eye out on expected fluctuations due to newly launched campaigns from unforeseen variances. Those variances may signal underlying problems demanding attention, . By grasping the direction in which a trend is heading, users are empowered to:
- Visually spot marked changes on graphical representations within Google Analytics.
- Reveal specifics by hovering over these indications.
- Delve deeper through utilization of features like ‘Investigate report’ for comprehensive examination.
Optimizing alert configurations within GA involves emphasizing consistent tracking focused on enduring tendencies rather than merely reacting to transient surges or decreases reflected in your datasets.
Streamline insights and marketing reports with Unito’s GA4 connector
Consider enhancing your data analysis process by incorporating the Unito GA4 Connector with Google Sheets. This clever integration facilitates automatic spreadsheet updates using real-time data, enabling the creation of dynamic reports straight from GA without the need for manual exports. To do so, you’ll need to add the Unito Spreadsheet Sync add-on for Google Sheets first.
Organizations can achieve a more efficient analysis and decision-making workflow by utilizing Unito’s GA4 Connector to automate report generation within Google Sheets. With continuously refreshed data at their disposal, this seamless integration revolutionizes how you compile, scrutinize, and capitalize on insightful reports.
Unito Makes Reporting Easy
Don’t spend hours creating your next report. Integrate Unito’s Google Analytics 4 connector with Google Spreadsheet and make insightful, actionable reports in minutes. You can try it with this free GA4 Website Performance Dashboard template for Google Sheets!
Frequently Asked Questions: Trend Changes and GA4 Insights
What are GA4 insights?
Insights from GA4 are tailored notifications that surface in the Insights Dashboard, identifying significant shifts in your data and providing critical information for your team. These insights are a component of Analytics Intelligence, employing machine learning along with user-defined parameters to facilitate comprehension and informed action based on data.
How do I get to Google insights?
To view the insights that pique your interest, log into Google My Busines from a desktop, choose the specific location you wish to manage, and then click on the Performance button in order to gain access to Google insights.
What is the difference between insights and analytics?
While analytics offer a range of possible explanations, insights are honed in on gaining a genuine comprehension of the events occurring within your business and with regards to your clientele.
Analytics: The foundation of digital marketing
Analytics encompasses the systematic process of collecting, cleaning, organizing, and interpreting raw data for a variety of marketing purposes. This includes web traffic analysis, campaign performance tracking, customer segmentation, and much more. It focuses on the “what”: identifying patterns, trends and anomalies within the data.
Insights: The reasoning and rationale behind your data
The key purpose of insights is to reveal the actual narrative that lies beneath the data, fostering an enhanced grasp of your organization’s inner workings. They go beyond simple reporting to uncover the reasons behind the numbers. A true insight tells you why a particular metric changed, why a campaign succeeded or failed, and why customer behavior follows a specific pattern.
What are insights in Google Analytics?
Google Analytics provides insights, which are automatic notifications that highlight significant user trends and alterations in your data. These alerts keep you updated on important occurrences within your GA4 property and can be tailored to align with your unique requirements.
What’s the difference between automated and custom insights in Google Analytics?
Automated insights in Google Analytics are the result of machine learning algorithms sifting through data, whereas custom insights provide an opportunity to hone in on particular business metrics and objectives for a more tailored analysis.
By customizing insights to align with specific goals, businesses can achieve a personalized examination of their data.
Try Unito for 14 days, absolutely free.