
How to Use Google Analytics 4 Exploration Reports: A Guide
Google Analytics 4 provides you with plenty of standard marketing reports that you can use for measuring engagement, traffic, and conversions. But sometimes you want to dive deeper into your metrics. As marketers, we often get asked what does the data mean or what insights can I pull from it?
One way to get key insights into your data is via the Google Analytics 4 Exploration Reports. In this article, we will help you discover what you can do with this GA4 reporting tool.
In this article:
- What are Google Analytics 4 Exploration Reports?
- Where can These Reports be Found?
- Types of Exploration Reports
- How to Create a GA4 Exploration Report
What are Google Analytics 4 Exploration Reports?
The exploration techniques available in GA4 allow for nuanced data analysis so you can uncover patterns and trends in the user journey that can inform strategic decisions.
If you’re trying to compare the current GA4 reporting with the old Universal Analytics (UA) reporting, then you can think of these as the “modern” version of Behavior and User Flow reports. They provide similar information, but with a lot more information.
Google describes Explorations as “collection of advanced techniques that go beyond standard reports to help you uncover deeper insights about your customers’ behavior”. You can leverage the Exploration reports to create segments, query specific data, and review GA4 insights into what your target audience is doing on your site.
Where can These Reports be Found?
Tab Settings play a crucial role in customizing user explorer reports. The Tab Settings pane allows users to select specific exploration techniques, apply up to ten metrics, and configure the data displayed on each tab. You can then parse through exploration data from Google Analytics to asses multiple metrics whether you’re looking at User Acquisition Date, Device Category, or other analytics data.
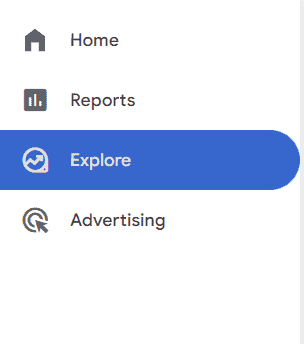
While it might seem like all these reports should be found within the “Reports” tab, they are not. Explore has its own section. To navigate to it, you must hover over the left-hand sidebar and click on “Explore”.
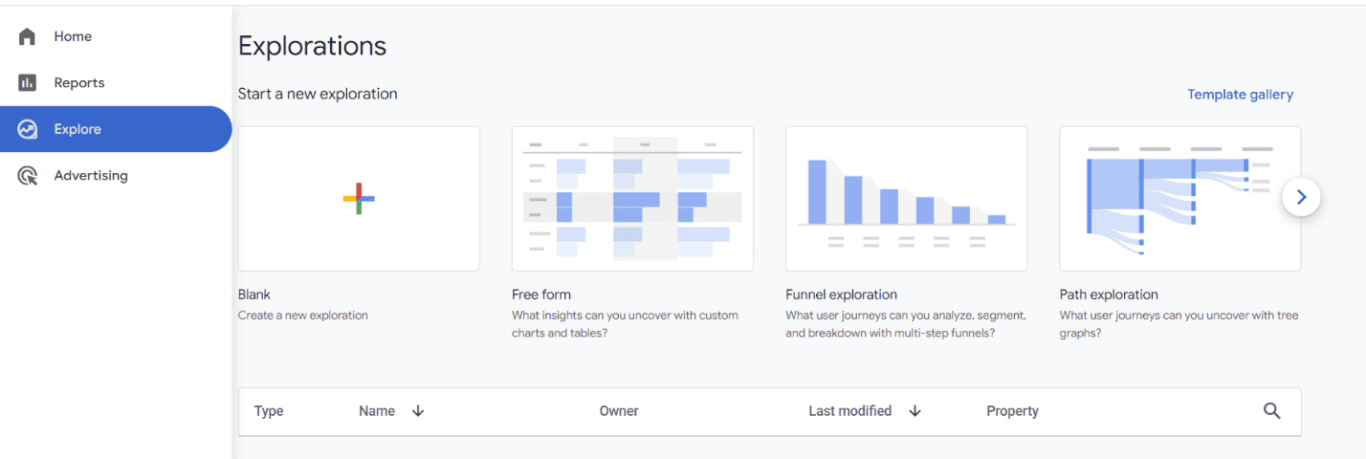
This will take you to the main screen of the Exploration tab. Within this screen, you’ll see different options for reports, including a Blank report, Free form, Funnel Exploration, and Path exploration. (Hint: if you haven’t set up an Exploration report before, then start with a template. Starting with a blank template can be a bit intimidating if you don’t know what you’re doing.)
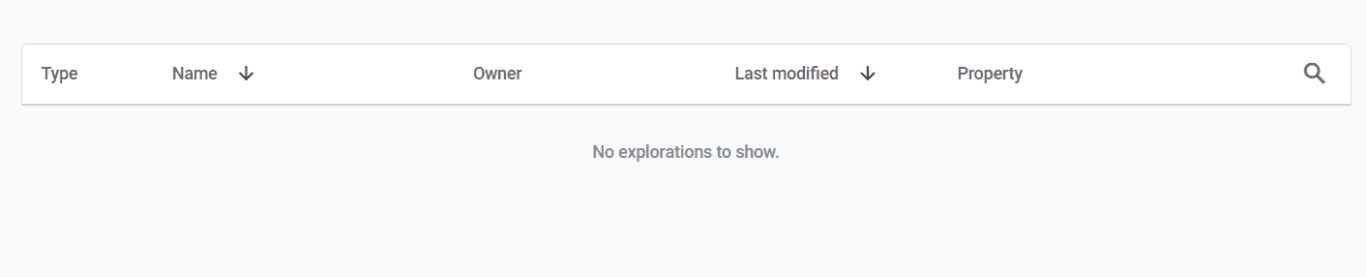
If you’ve built a report in the past, you’ll see all your reports on this screen as well. Just scroll to the bottom of the page, and you’ll see the name, owner, type of report, etc. here. This makes it easier to click into an established report and update it.
Types of GA4 Explorations Reports
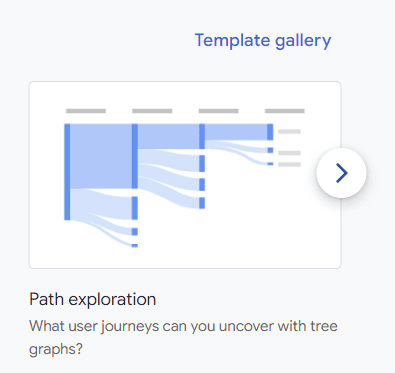
There are seven types of GA4 Exploration Reports. You can’t see them all from the main page. You have to click the link to the “Template gallery” on the top right-hand side of the page to pull up all your options.
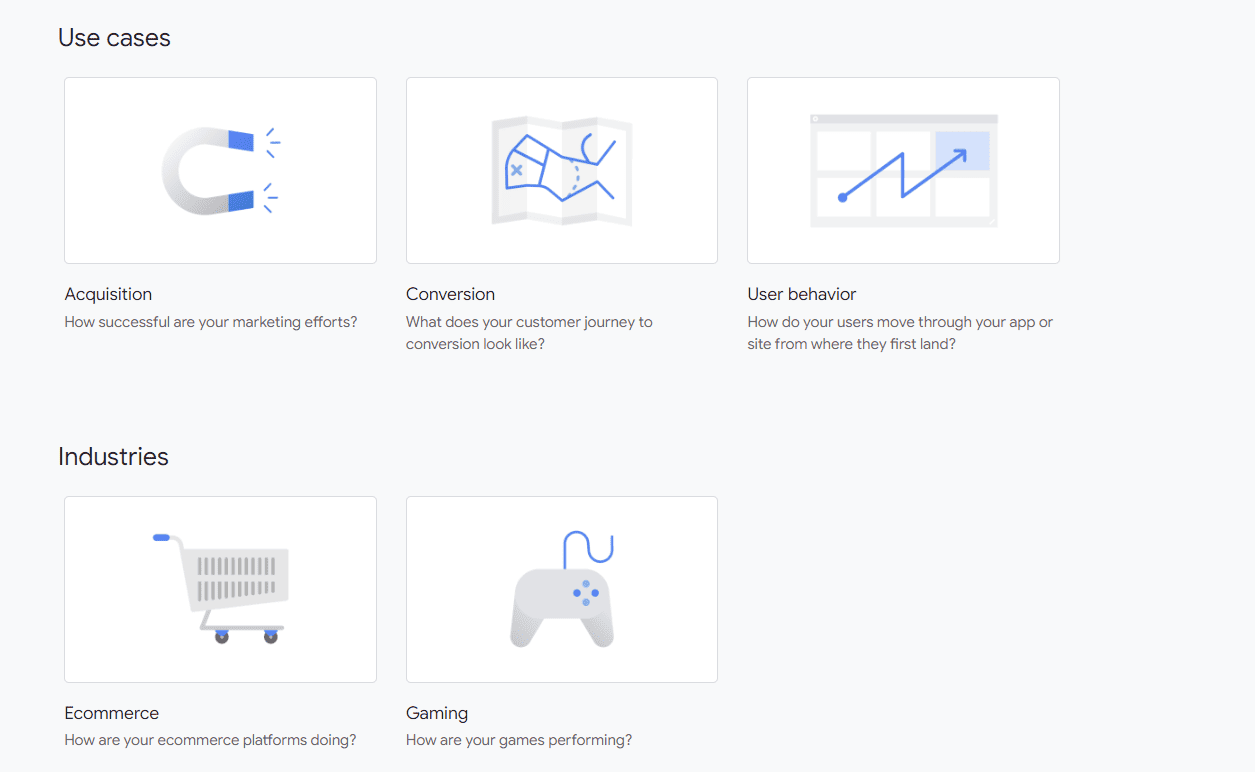
Once in the Template gallery, you’ll find the seven types of reports and some other options. For example, if you scroll past the “Techniques” section, you’ll find reports for Use Cases and Industries. These are pre-built reports that you can use to determine how well your marketing efforts are doing. Since these just require some minor tweaks to get information on user behavior or conversions, for example, they could be a quick way to gain some insights.
The focus of this screen, however, is the Techniques section. This is where you’ll find all seven types of reports.
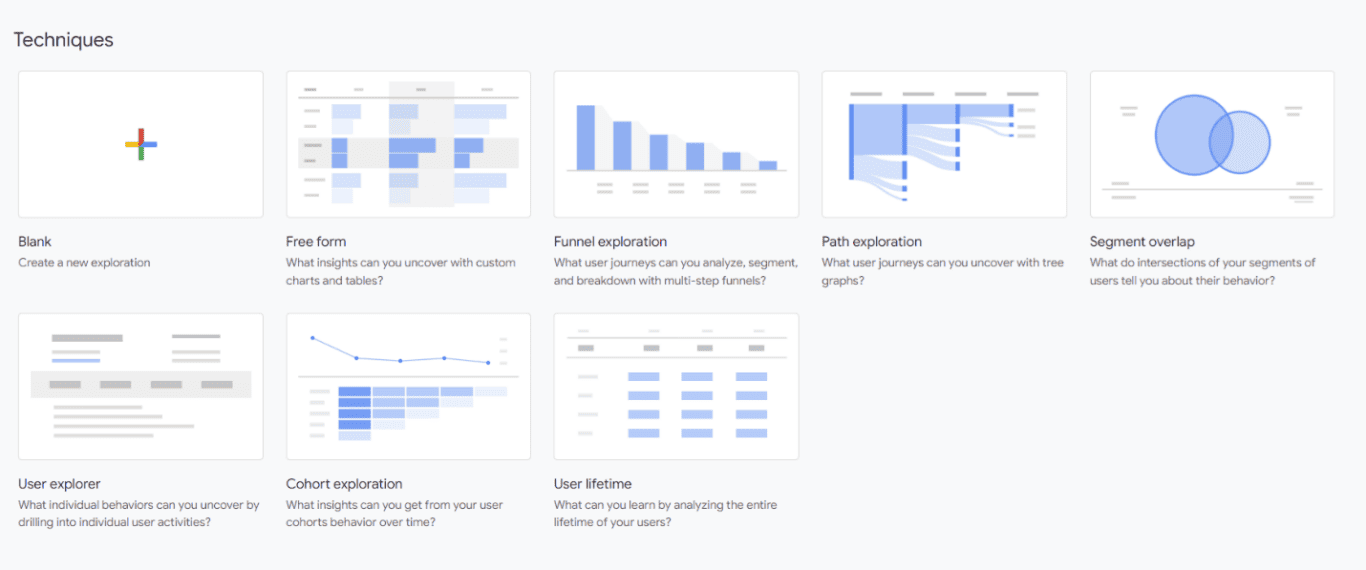
Free form reports
A GA4 free form exploration report helps you visualize your data in a table or graph like bar charts, line charts, geo maps, etc. You can create customer segments to focus on your most important target audiences. With this data from a free form report, you can determine if there are any anomalies or whether you’re meeting revenue goals.
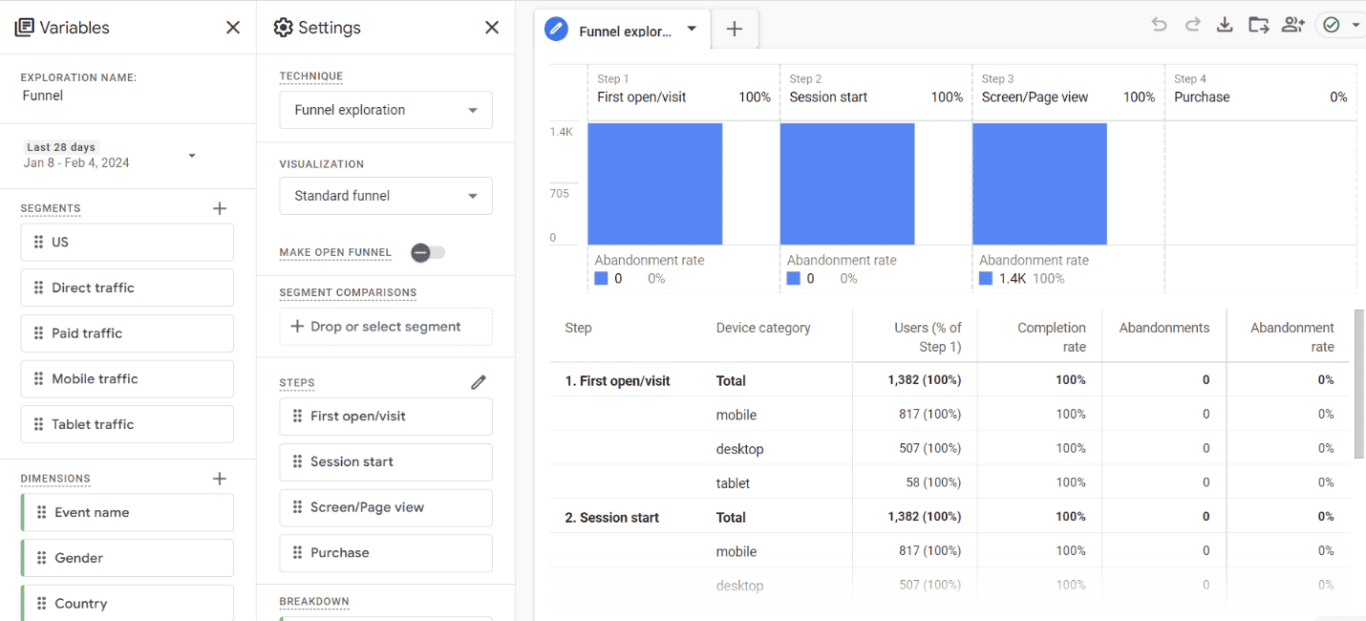
Funnel exploration
You can think of a GA4 funnel exploration as the old funnel path in UA. It basically works the same, you can see what steps a visitor took to complete an action on your site. This helps you determine whether the user experience is good and where people are dropping off. You can also leverage this report to determine which target audiences are meeting expectations and which are not.
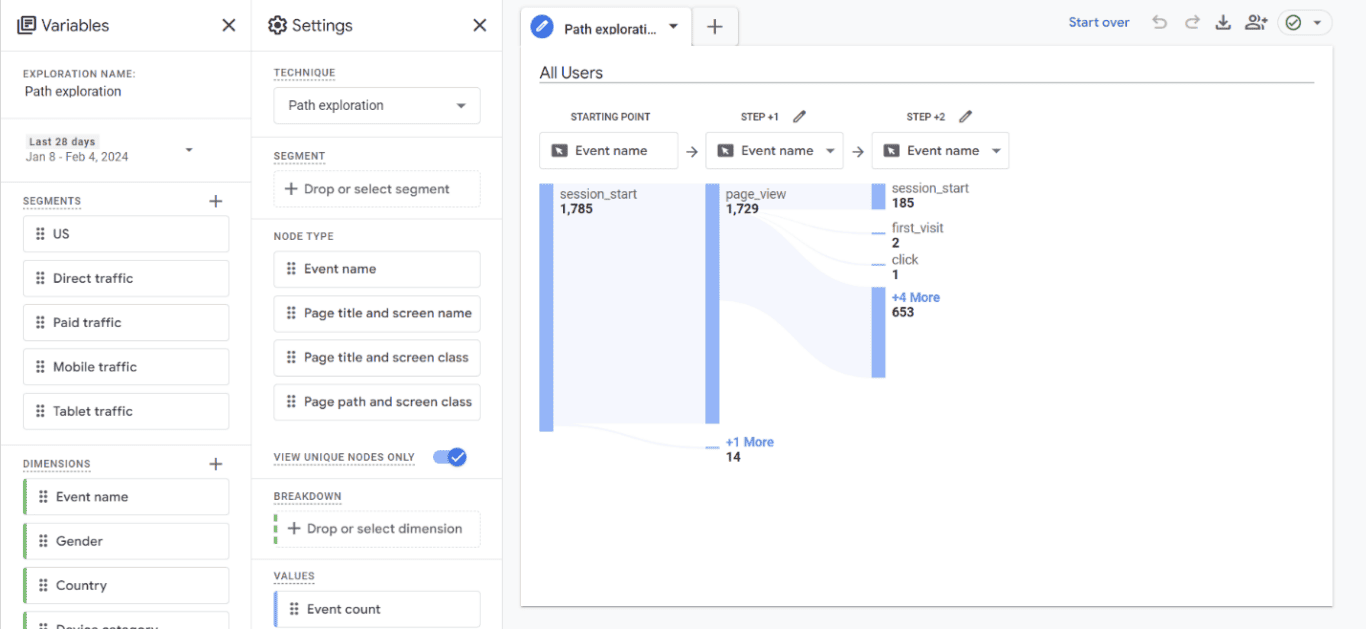
Path exploration reports
GA4’s path exploration report is similar to Behavior Flow in the old UA reports. It helps you visualize the path other users take as they move through your website. This is complemented by the Tab Settings column, where you can refine your exploration by adjusting the dimensions and metrics applied to your analysis of user segments.
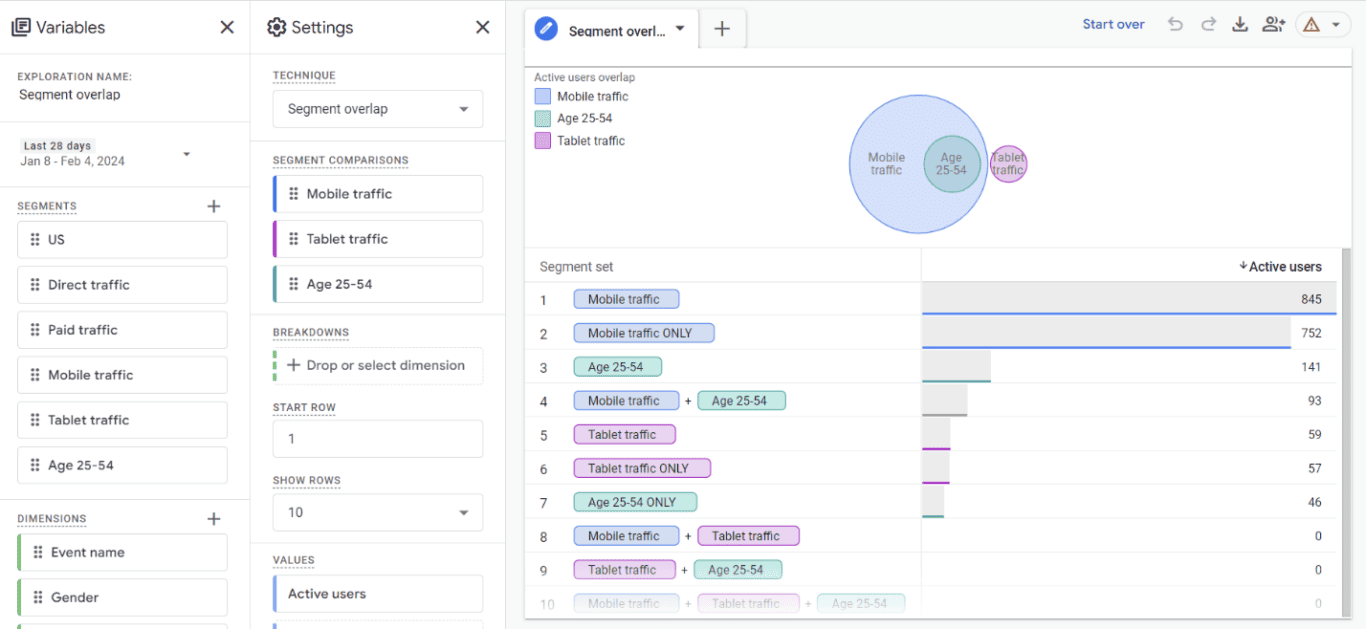
Segment overlap reports
A GA4 segment overlap report allows you to compare up to three different segments. For example, you could compare traffic from different devices or users from different areas of the country to see how they relate to each other. You can use this data to even create new audiences.
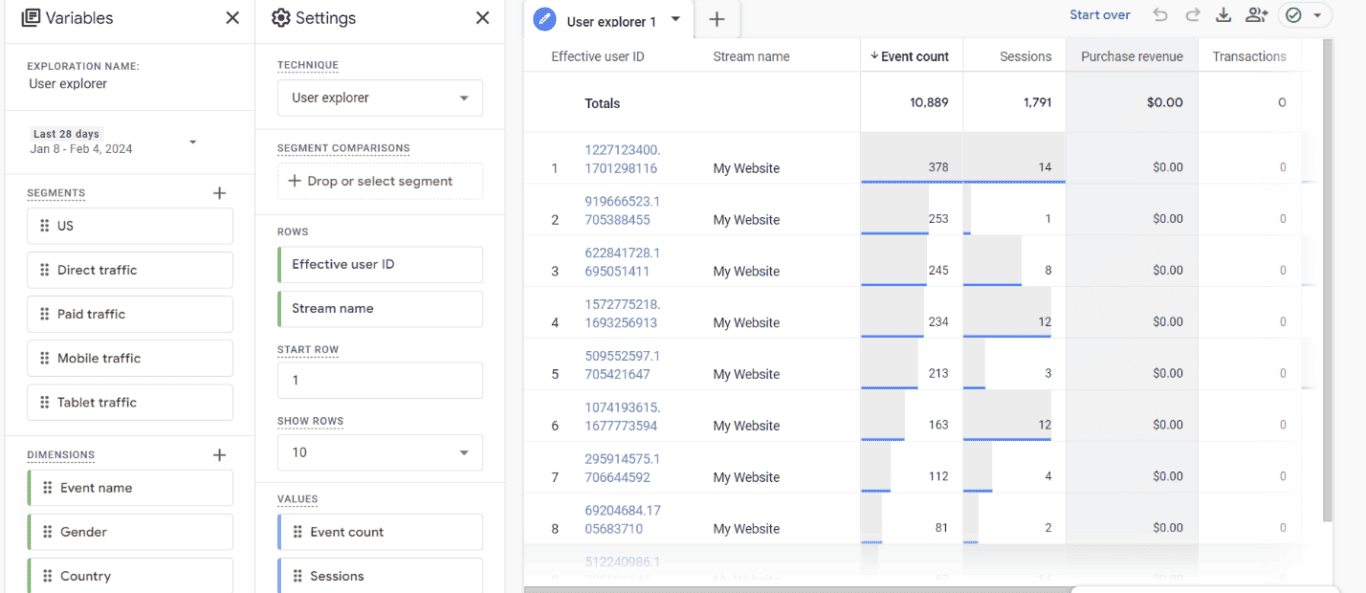
User explorer reports
The User Explorer report in GA4 allows you to visualize how a single user moves through the site. This custom exploration can be particularly insightful when combined with the User Lifetime exploration technique, which looks at user behavior and value over their entire lifetime as a customer.
For example, you could follow a single customer during the purchase journey. This helps you figure out whether there’s a problem with the user flow (i.e. high cart abandonment) or look at how users engage with site via different browsers.
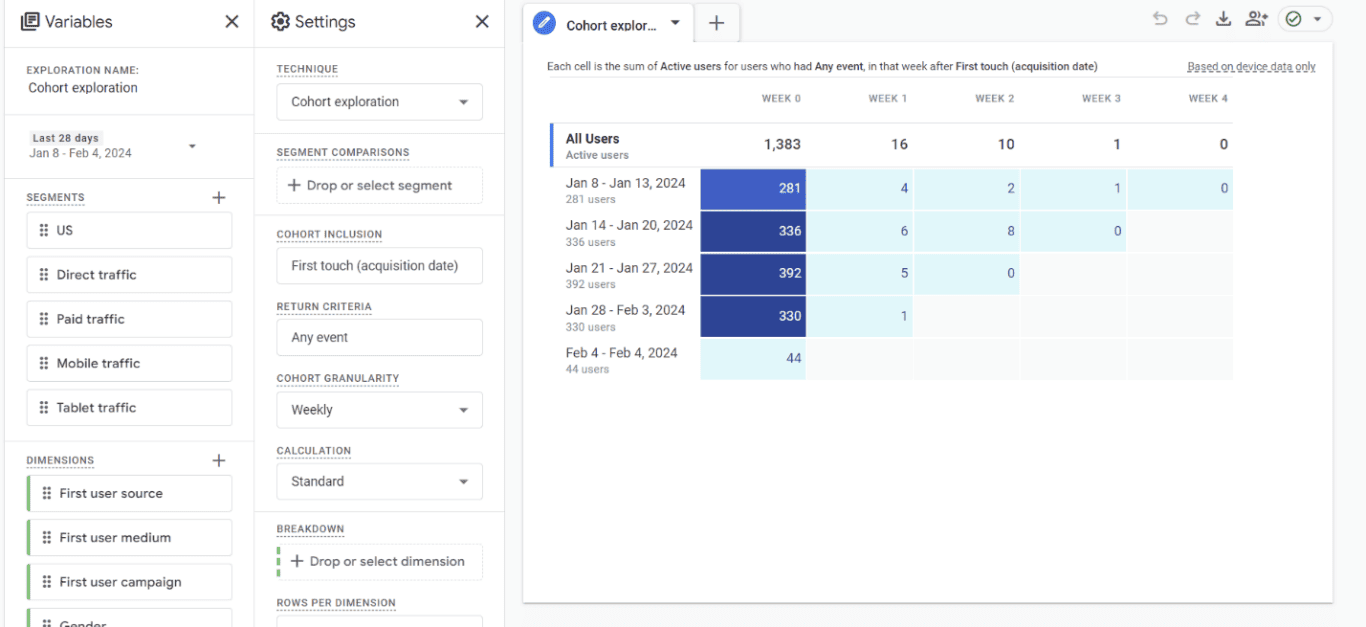
Cohort exploration reports
A cohort is a group of users with common behaviors or traits, for example, people who live in the same area or buy the same types of products. You can leverage a cohort exploration report to gain more in-depth insights into their behavior in your app or on your website.
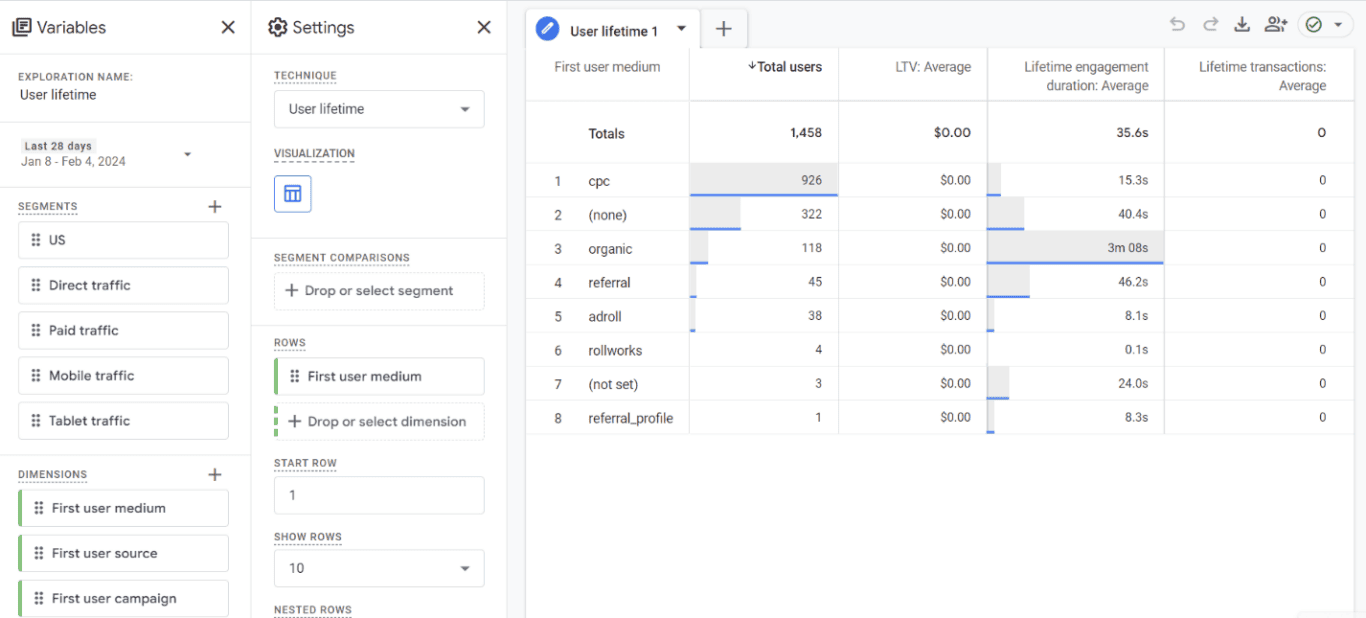
User lifetime reports
You can view the entire lifetime value of a customer and the user’s behavior with a GA4 user lifetime report. Customer lifetime value (LTV) is an important metric for many stakeholders. This helps visualize that data.
You can also use this exploration report to determine the probability of someone becoming a returning customer and get forecasts on possible customer drop off. You can even compare first, last, and most recent purchases or other events and user behavior.
Summary of report types
In each of these reports, you’ll notice “Variables”. Variables in GA4 are the different metrics, dimensions, and segments that you can use within your reports. These include anything from location to gender to device to traffic data. If a particular metric or dimension is grayed out, that means that you can’t use it in these types of reports – or you’re already using it.
You can even change the time frame. This can be helpful if you want to compare data during a certain time frame (i.e. an event) or compare current and past data.
Data retention in GA4 Explorations
GA4’s Data Retention Settings let you adjust how long your Google Analytics data is stored, balancing the need for historical analysis with privacy considerations. The Exploration Data itself is a treasure trove of user level data, offering actionable insights into everything from Active Users to conversion paths.

- For Universal Analytics properties: In the PROPERTY column, click Tracking Info > Data Retention.
- For Google Analytics 4 properties: In the PROPERTY column, click Data Settings > Data Retention.

- For Universal Analytics properties: User and event data retention: select the retention period you want.
- For Google Analytics 4 properties: Event data retention: select the retention period you want.

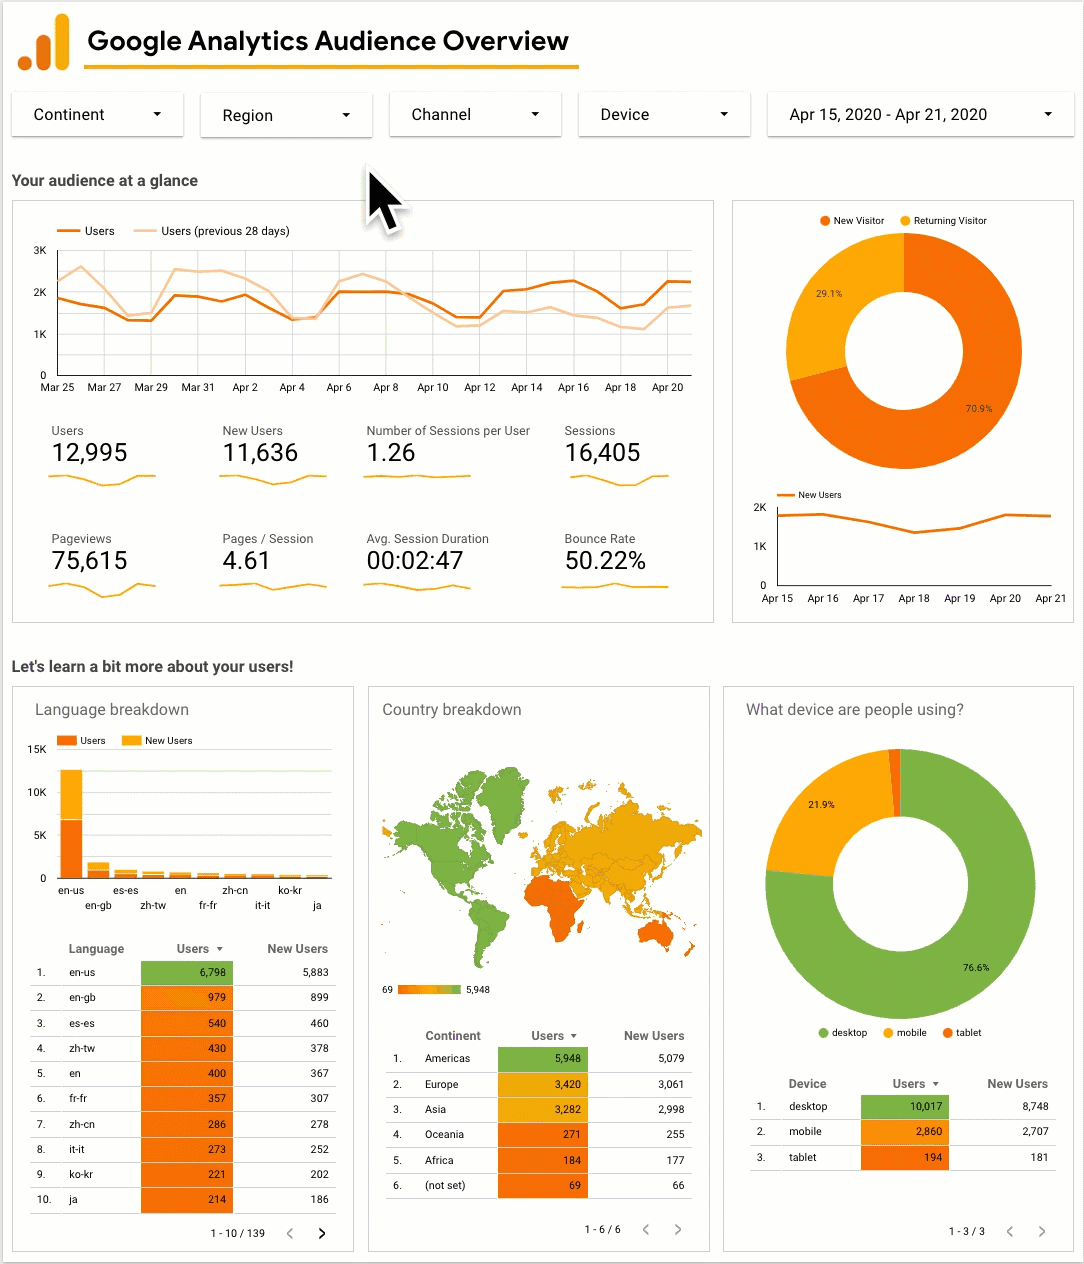
Visualize data in GA4 Explorations
Visual representations such as the Bar Chart and Data Table in the Variables Column help to make complex data more digestible, allowing for quick identification of trends and outliers. For those looking to dive deeper, the User Exploration and Custom Exploration options provide the tools needed to create a custom report tailored to your cohort analysis or user group.
Whether you want to explore data from user journeys with up to five dimensions in a New Exploration Report or seeking specific insights from a User Lifetime Exploration, in GA4’s Explore feature offers a versatile and powerful suite of tools to uncover insights from all the data you can handle from audience segments.
How to Create a GA4 Exploration Report
Now that you understand the purpose of these reports and analytical techniques, you can start creating your own path analysis, or reports in Google Analytics. If you use one of the templates, you only need to change the variables to manipulate your GA4 exploration reports. But if you want to create a free form exploration from scratch, click on the “+” sign on the Blank report. You’ll be taken to a blank template.
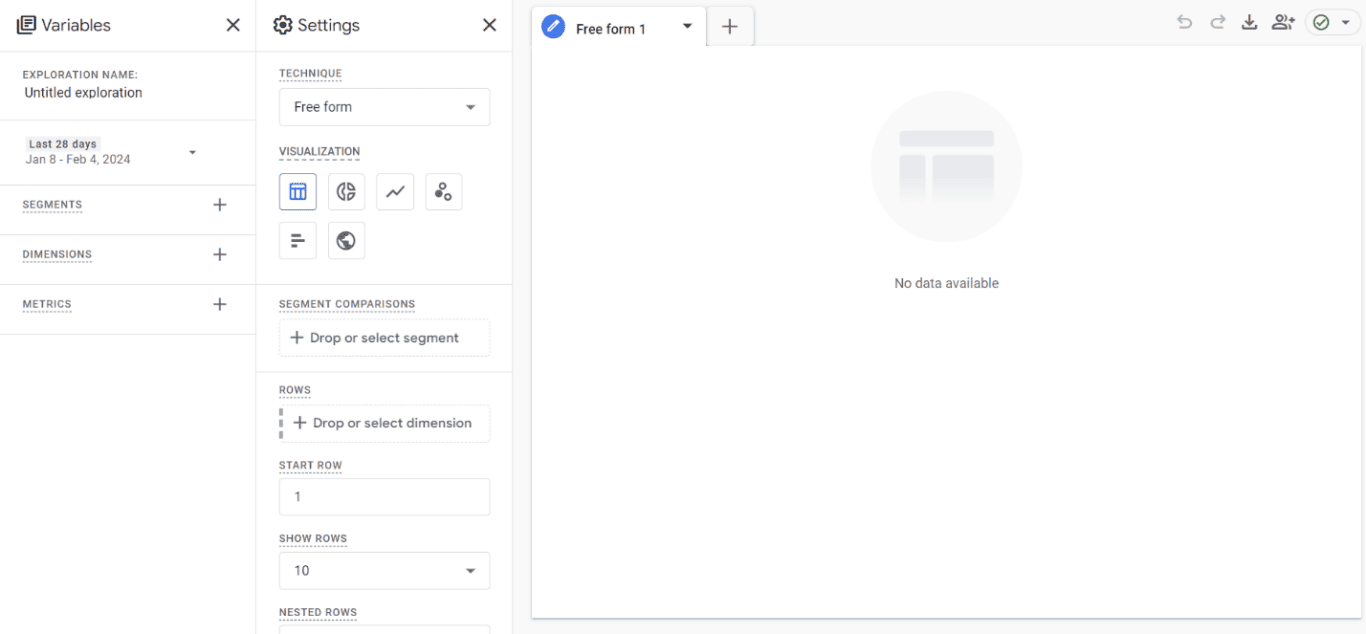
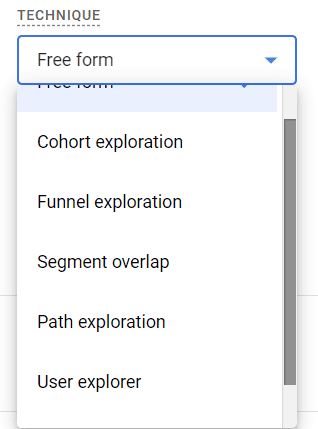
Start by selecting the “Technique” that you want to use for your free form exploration. This will be the different GA4 Explorations reporting options.
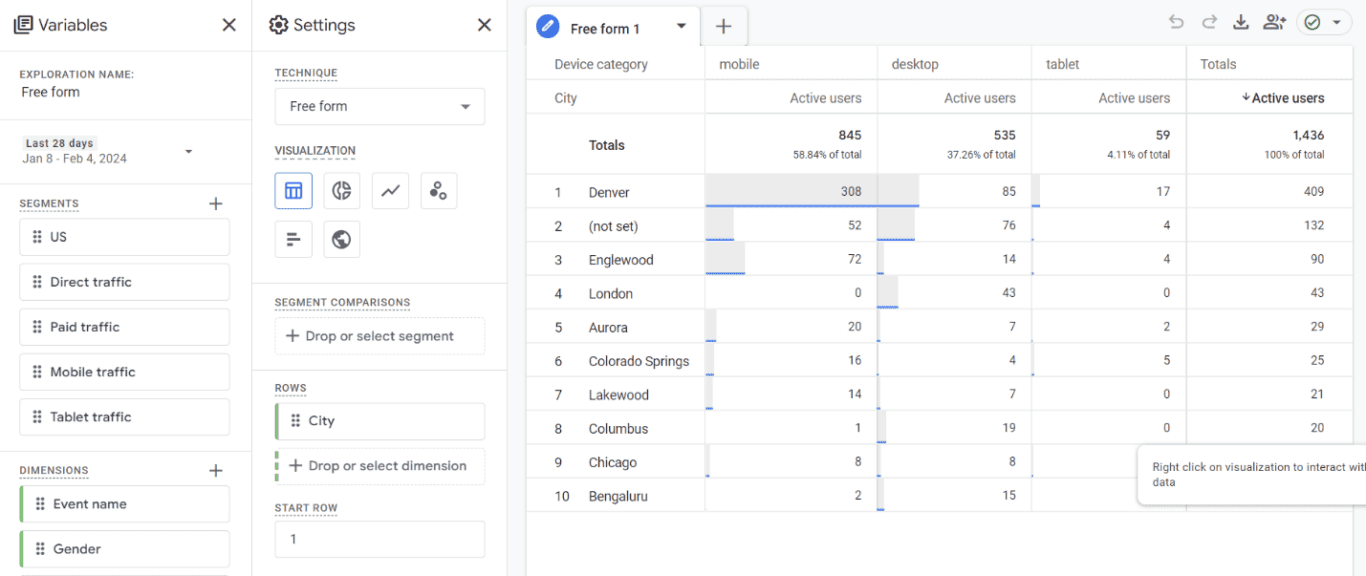
Pick your variables
Begin by determining the date range that you want to use, and then you can add your dimensions and metrics. If you’d like to include a segment, you can also display data here for your final report.
When you click on the “+” sign next to Segments, Dimensions, or Metrics, you’ll open to a screen similar to this one:
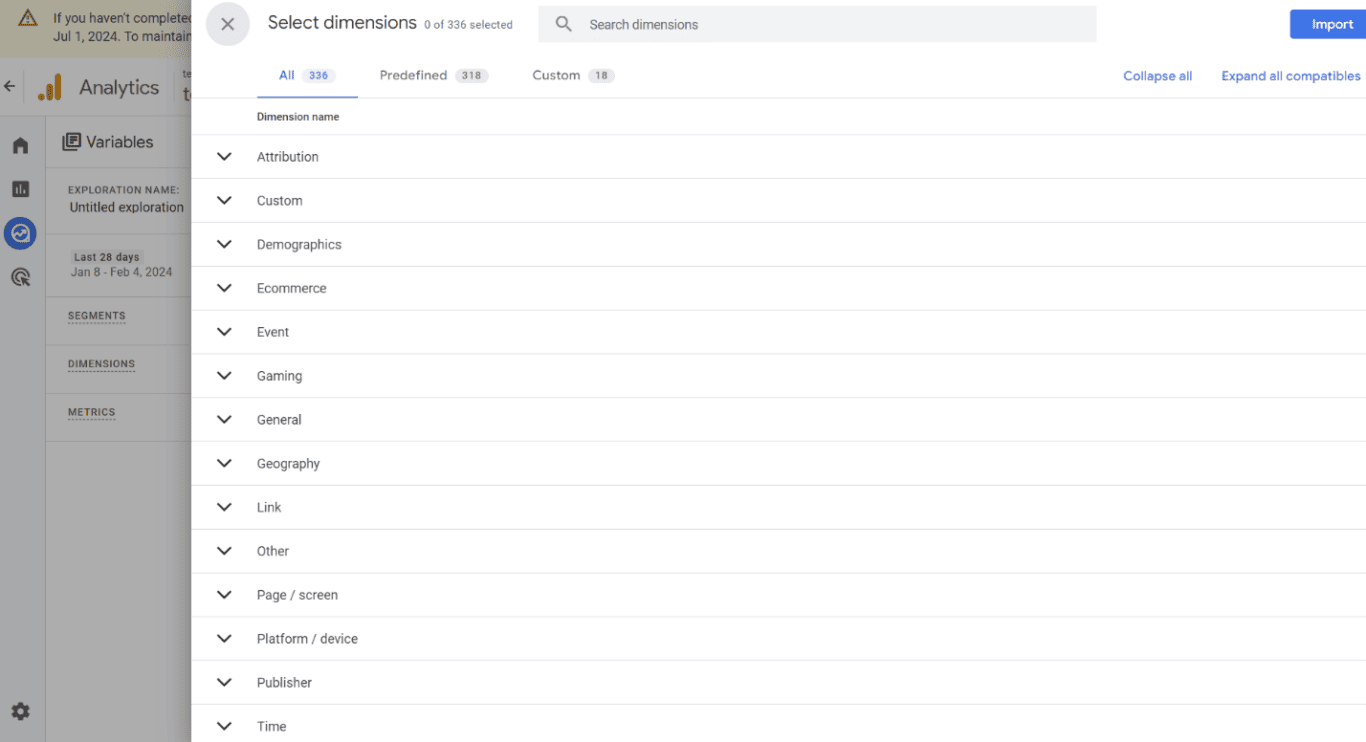
Here, you can search for different dimensions or metrics. You can even import raw event data, dimensions and metrics from other sources.
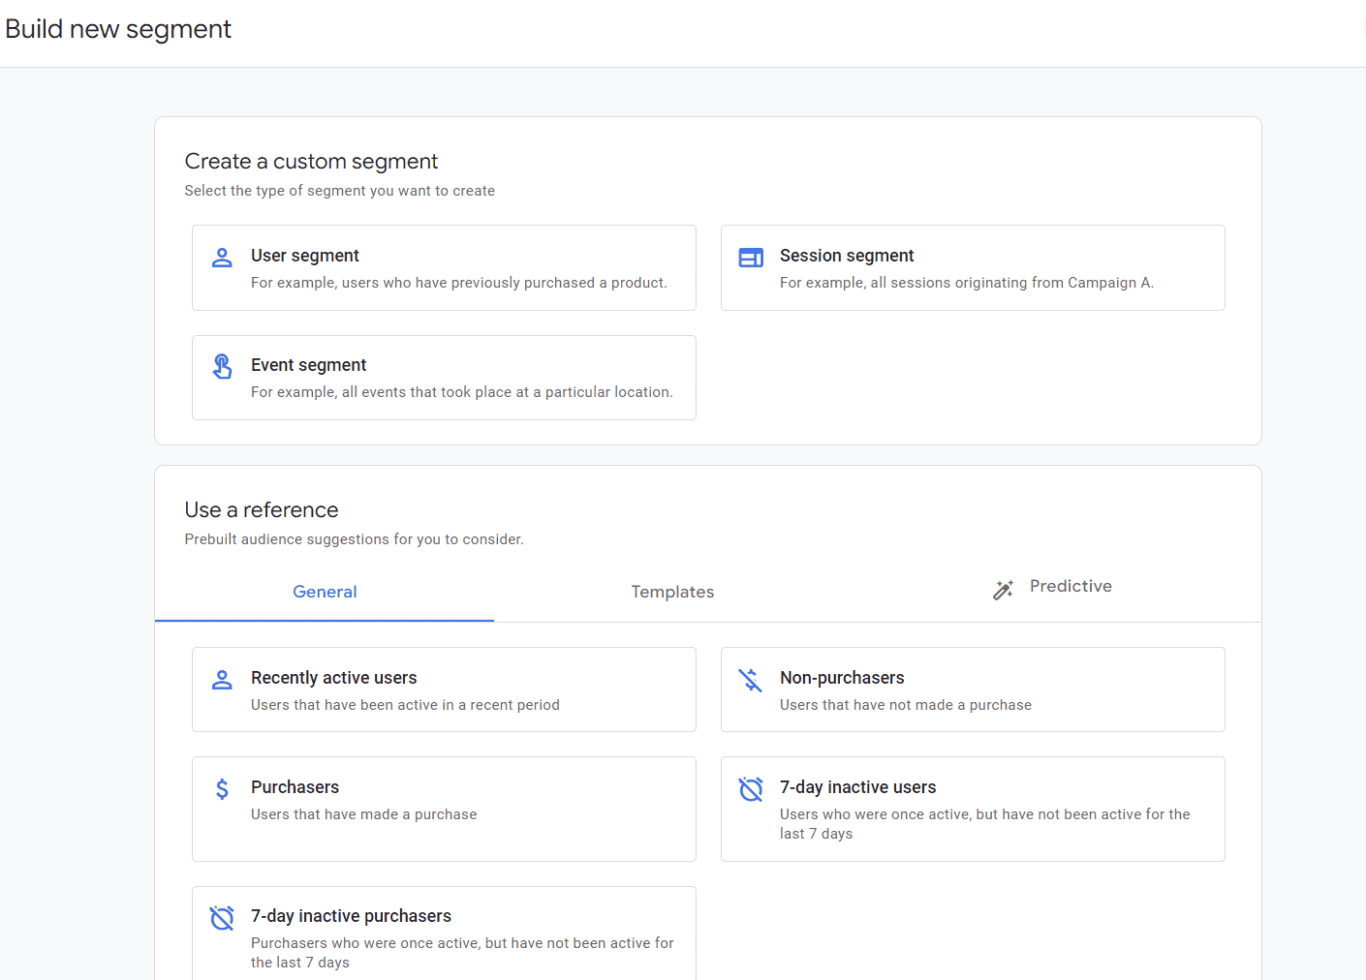
Build a new segment
In Segments, you can create custom segments, or you can use pre-built ones.
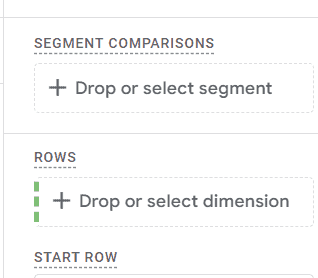
Once you build your dimensions, metrics, and up to four segments, you have to drag and drop them into the “Settings” sections for them to show up on your reporting screen.
Once that’s done, you should see your report in the right-hand screen. Now, all you have to do is save it, name it, and export data or reference it in the future.
GA4 Connectors Are Here!
If you found this article on how to access explorations useful, we can help you give your GA4 exploration reports a boost! Unito’s automated integration for GA4 makes syncing an exploration report to a spreadsheet simple.
Sync user behaviour, free form report details, segment overlap, custom date range, landing page dimension, site search data and anything else you might want to share from a GA4 exploration report to Google Sheets or Microsoft Excel.
Our connectors seamlessly integrate with GA4 to ensure that you have beautiful, insightful reports to share with your clients and stakeholders on user behaviour, cohort exploration, segment overlap and more. Want to build a GA4 report in Google Sheets? Here’s a template for doing that.
Forget all the manual work. Your custom date range, including weekly, monthly, or annual reports can be done in minutes.