The Ultimate Guide to Automated Reporting
If you’ve ever contributed to a report, you know just how time-consuming this process can be. You’re staring at spreadsheets for hours, double-checking data, and moving charts around until you get something serviceable that you can send off before calling it a day. And often, you’re going to do it all over again in a couple of weeks. If you groaned while reading that, then you definitely need to learn about automated reporting.
Here’s how it works.
What is Automated Reporting?
Reporting is all about keeping people in the loop. That can mean communicating the status of a particular project, sharing timesheets for a whole team, or drafting financial statements for an entire company. Project managers, team leads, executives, and individual collaborators might all be responsible for a report at some point in their careers.
Automated reporting means using technology to make that process smoother, whether by automating data entry or keeping tools in sync
Why you should automate your reports
Automated reports don’t take much more effort to set up than their manual counterparts, and they have several advantages:
- They save you time.
- They can be updated automatically.
- They consolidate data from multiple sources.
- They can be used to create a live dashboard anyone can consult on their own time.
In Unito’s Report on Reporting, 150 respondents shared some of the biggest problems with their reporting workflows. More than a third of them said they spent at least three hours a week on reporting, and 40% of them updated their reports once a week on average. So anything that can save you time on building reports is a huge asset.
Best tools for automating reporting
An automated report can be built with any platform, from a project management tool to a spreadsheet. No matter what platform you’re already using, there’s definitely a way to automate at least some of the process. With that in mind, here are some tools you should look to when automating your reports.
Project management tools
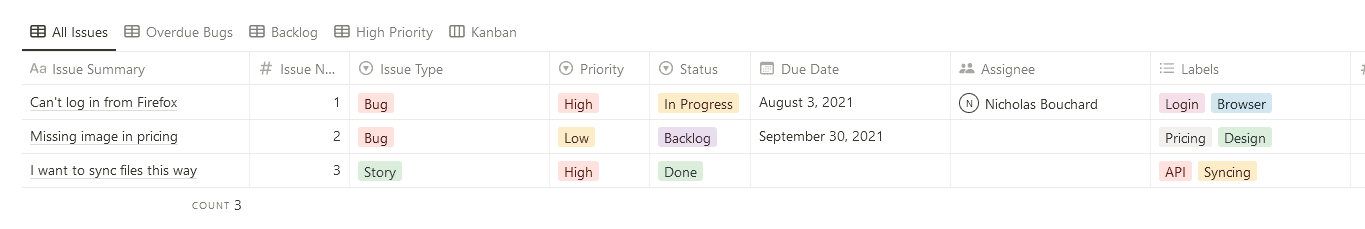
Odds are your project management app of choice already has some way of creating reports, and some of that can be automated away. Asana, for example, lets you report on an individual project’s status, the progress of a whole portfolio, or even an entire workspace. Trello has its own reporting dashboard, and the list goes on. Many of these tools automatically pull information from relevant projects and collaborators, meaning you don’t have to export it somewhere else or collect it yourself. So before you look into any specific reporting tool, check to see what you can get done with your project management software.
Dashboarding tools
These tools automatically pull data from multiple sources while giving you the ability to organize how it’s displayed. Particularly tech-savvy teams can create dashboards that cover their work and track a whole host of performance metrics over time. Tools like Dasheroo, Datapad, and Grafana are all examples of dashboarding tools that are great for building live, automated reports.
Workflow management software
A workflow is a repeatable process you use to get things done while workflow management software helps automate and streamline every step in that process. This umbrella term can sometimes include project management tools like monday.com, but generally refers to platforms like Unito that push data and keep it in sync throughout your workflow.
Why spreadsheets are the ultimate automated reporting hub
You’re probably already using spreadsheets for some of your reporting workflows, but did you know they’re the best platform for automated reporting, too? Not only are they ubiquitous — you probably have a spreadsheet open in a tab somewhere right now — but anyone can learn to use them pretty quickly.
But their strongest advantage is in how easy it is to automate them. Spreadsheets are naturally compatible with some of the best automation platforms on the market right now. Platforms like Unito. With a tool like Unito, you can pull data from any spreadsheet, push it to any other, and keep everything in sync in both places. Not only that, but you can also sync work from project management software, version control tools, and more to your spreadsheets. Combine that with data validation functions, charts, and everything else spreadsheets have to offer, and you have the best automated reporting hub possible.
Automated reporting for different needs
Automated reporting is about making reporting workflows run more smoothly — without adding manual work — throughout the entire organization. With that in mind, let’s dive into the different ways you can roll out automated reporting for all sorts of needs.
Marketing reporting
Marketers need reports just like any other team does. For a marketing team, reporting can ultimately make the difference between a costly, inefficient dud of an initiative and a game-changing campaign that propels the business to new growth. That’s because every marketing initiative is a careful balancing act. How many resources need to go in? How much new business is coming out of it? Here are some of the most common reports a marketing team will work with:
- A marketing overview report, which tracks and share key results from all marketing channels. These are usually created annually or quarterly.
- Marketing campaign reports, which communicate the results of a specific marketing campaign and the channels it spanned.
- Social media reports, which communicate the performance of your social media channels.
- Email marketing reports, which are used to share how various email marketing campaigns are performing. Often, these reports will need to bring together multiple campaigns.
Marketing reporting is absolutely essential for high-performing marketing teams, but it doesn’t have to be a burden if it’s automated the right way.
Sales reporting
Sales teams might be the team for which getting reporting right is the most directly valuable. Everything your sales team does is aimed at bringing in more prospects, turning more of those prospects into customers, and ultimately growing revenue. To do that, they need information. Because while making a thousand cold calls a day will certainly bring in new customers, it’s far from being the most efficient way to do so. And with the right data — and the right report — you can make that abundantly clear. Sales leaders can use reports to answer tough questions, guide their teams in the right way, and get support from stakeholders. Here are a few ways you can automate your sales reporting workflows.
- Use the tools you’re in every day: Some of the most popular sales tools on the market, from HubSpot to Salesforce, have powerful built-in reporting features that require little to no manual work to set up.
- Integrate your tools: Just because you’re in Salesforce every day doesn’t mean that’s where all the data you need is. That data can be scattered throughout CRM platforms, spreadsheets, contact management tools, and more. With the right integration, you can centralize all that information.
- Monitor, improve, and review: Automated reporting can be quick to set up, but you shouldn’t think of it as a one-and-done process. Review your processes at least quarterly to get a good idea of what you can improve, what you’ve already accomplished, and how to report more effectively on your sales numbers.
SEO Reporting
Search engine optimization (SEO) refers to a number of best practices used to help a website rank in the top positions of Google’s search results. A marketing agency, for example, would use SEO to try and rank for keywords like “marketing agency,” “marketing consultant,” and “marketer for hire.”
SEO work involves a lot of reporting. Consultants, marketers, and other specialists need to carefully monitor the search performance of the websites they’re working on and communicate that performance in a way stakeholders can understand. These reports need to include a number of important SEO metrics:
- SEO-related KPIs: These KPIs represent the outcome of your successful SEO work. If you run a successful software company, that might mean the number of signups you get from your website. For a travel agency, it’d be the number of booked trips.
- Keyword rankings: With proper SEO work, your website will start to rank for specific keywords tied to your industry. Reporting on these rankings is an important part of reporting on SEO performance.
- Organic traffic: Bringing in more website traffic is one of the key results of successful SEO work, so it’s important to report on this.
- Backlinks: A backlink is a URL that leads from another website to yours. The more backlinks you get from high-quality sites, the better your SEO performance will be.
New to building SEO reports? Maybe you just don’t want to start from scratch? Here’s a list of the best SEO report templates, straight from the experts.
Project management reporting
One of the biggest responsibilities of project managers is making sure stakeholders are kept in the loop as a project progresses. That means a PM can potentially spend hours working on reports every day, time they could otherwise put towards making sure the project actually moves forward.
Being able to automate even a few of these reports is a huge benefit for the project manager and the teams they work with. Whether they’re using automated spreadsheets, built-in reporting features from their PM tool of choice, or a dedicated integration solution, automation is the best way to bang out these reports in less time. Here are just a few of the reports that PMs might need to automate:
- Project status reports: This is probably the first report that comes to mind when you think of project management. A project status report is a regular report that allows PMs to communicate a project’s progress with various stakeholders. These reports might only be created quarterly for longer projects, or as frequently as weekly for high-stakes, urgent work.
- Project health reports: Slightly different from a project status report, a project health report takes a more global view of a project instead of focusing on specific tasks. They’re typically quicker to create, since the goal is to share a quick snapshot that communicates whether a project is healthy, at risk, or off track.
- Time tracking reports: Project managers sometimes need to track the amount of time a project team has put into their work, usually because other managers want to make sure their teams have enough time for other projects, too. That’s where time tracking reports come in.
- Risk reports: A risk report allows project managers to predict and communicate potential risks even before work starts on a project. Those risks can include a team member getting reassigned to a different project, an organization-level change, or even just going over budget.
- Variance reports: When project managers first plan their projects, they’ll usually share a roadmap that helps everyone understand what’s going to happen. With regular variance reports, PMs can communicate any events where a project doesn’t follow the roadmap exactly.
Curious to know how project managers can automate these reports? Check out these 10 tools for automating project management reports.
How to use automation in ad-hoc reporting
Ad-hoc reporting refers to all those reports that seem to just “happen.” They’re not part of a regular schedule, and they’re not mentioned in any project charter, but they’re still extremely important. Usually, an ad-hoc report gets created when a stakeholder suddenly needs one or a team needs an urgent update on a crucial project. They’re often done manually, which means anyone creating them needs to sacrifice at least a few hours of their day to get them done.
Unless you automate them.
If you’re already using one of the tools mentioned above to build automated reports, you can use them for ad-hoc reporting as well. But just in case you aren’t, here’s a step-by-step process to consider.
Make sure to choose a tool that’s scalable
Sure, if a stakeholder asks for a single report once in a while, you can get away with using a Google Doc and starting from scratch. But if you can anticipate that you’ll create these reports more than once, try to pick a tool that’s naturally compatible with your automation solution of choice — and make a template! Better yet, pick a tool that already has a wide range of templates available.
Keep your report as a template
Best case scenario, you’re already starting from a template. But for reports where that doesn’t make sense, at least save the final report as a template. That way, you can get started much more quickly in the future.
Try and share a live version instead
Most tools used for reporting have a way to share your work without allowing the viewer to make any edits. Sharing your report this way is generally a better option than sending a one-off export of your report. That way, your automated report can be treated more as a dashboard than a throwaway report — which makes your life a lot easier.
Want a full guide to ad-hoc reporting? You can find that here.
Dashboard reporting and automation
Dashboard reporting refers to a type of reporting where teams can get up-to-date data in a visual way, usually through a dedicated tool. These dashboards can pull in data from one source or many, but you won’t need any advanced technical knowledge to set one up.
Dashboards vs. static reports
Static reports are just that: static. They’re usually created as a one-off report, consumed, and discarded. They might be made on a regular basis — like a monthly report — or made just once, often because a stakeholder asked for them. Static reports capture a snapshot of your data at a certain point, giving you an idea of where a project’s at or how your team is doing.
Compared to this, a dashboard can have much wider uses, mainly because they’re kept up-to-date automatically. Stakeholders, team leads, and individual contributors alike can check in whenever they need to and find a real-time feed of what’s going on.
Automating a dashboard
Creating and keeping a dashboard updated without an automation platform would involve a ton of manual work — which would be better used for more important tasks. Whether you use a dedicated dashboarding tool (like Datapad), built-in dashboards in tools you use for other purposes (like you’ll find in HubSpot), or use an integration solution (like Unito) to make your own, automation is essential for this kind of reporting.
4 templates perfectly suited to automated reporting
One of the best ways to start rolling out automated reporting to your teams is with the right template. Thankfully, the internet is chock-full of them. Here are some of the best.
Google Sheets dashboard template
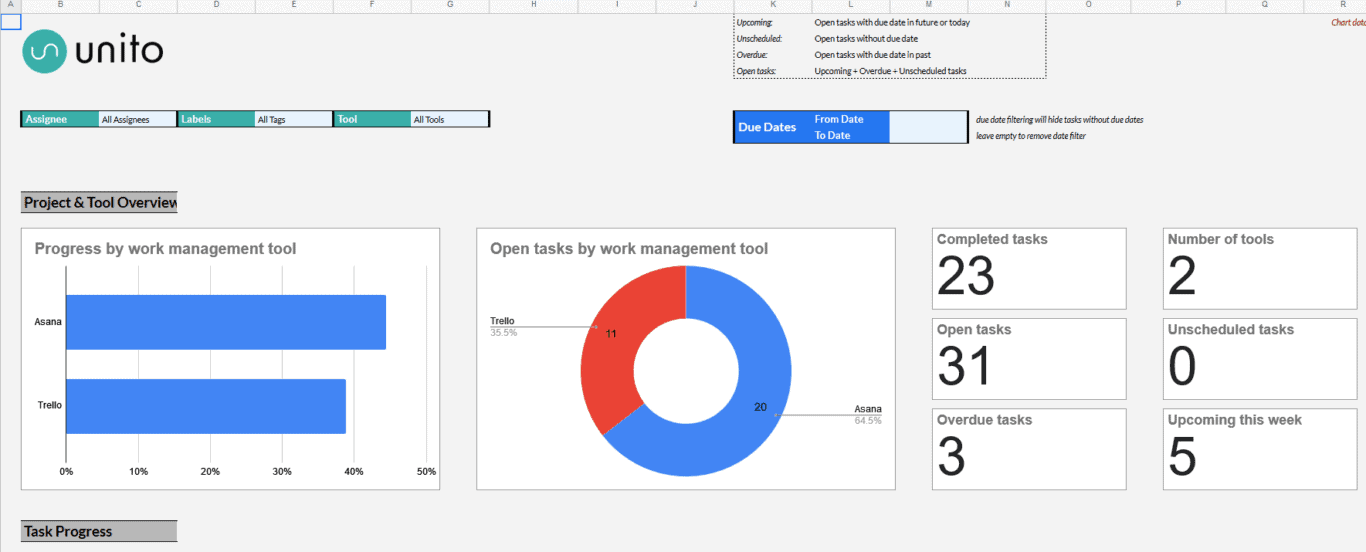
With this template, you can report on work happening in a project management tool — like Asana, Trello, or Jira — right in Google Sheets. You’ll get custom charts allowing you to track progress, track tasks by assignees, and more.
Microsoft Excel progress report template
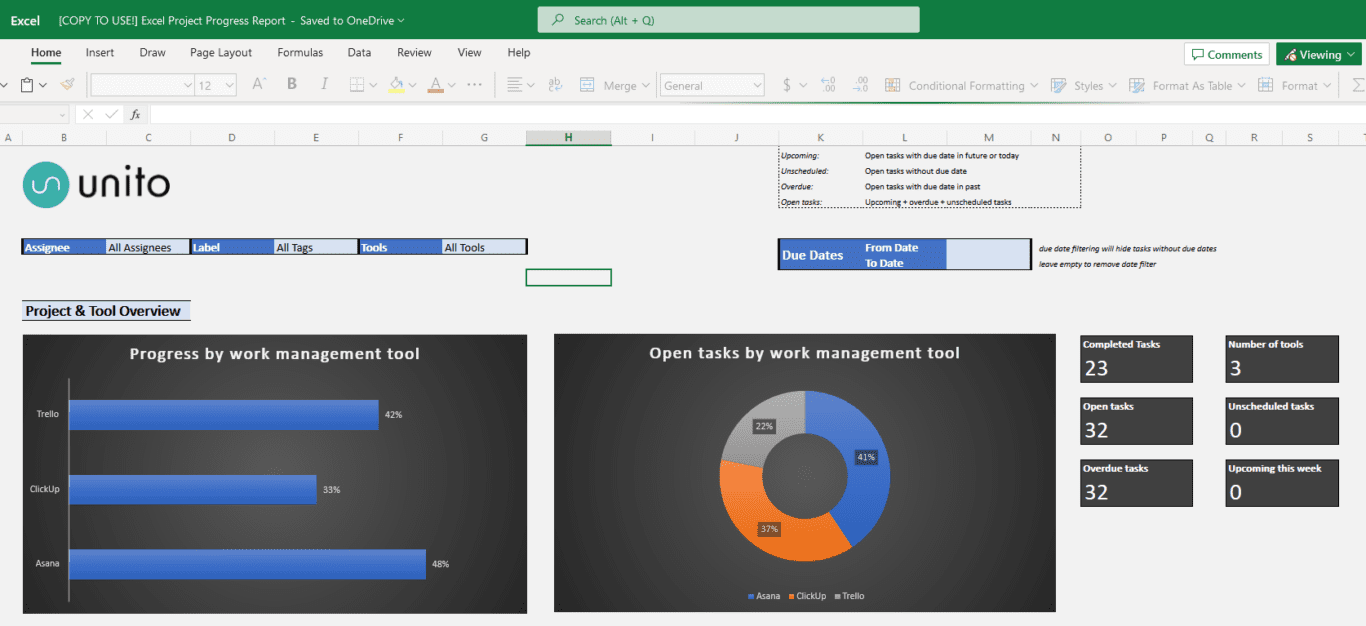
More of an Excel user? Here’s a template that’ll let you track progress for projects from your project management tool of choice right in Excel. The best part? You can use an integration like Unito to push data from your projects to this template automatically.
Automated project health report template for Airtable
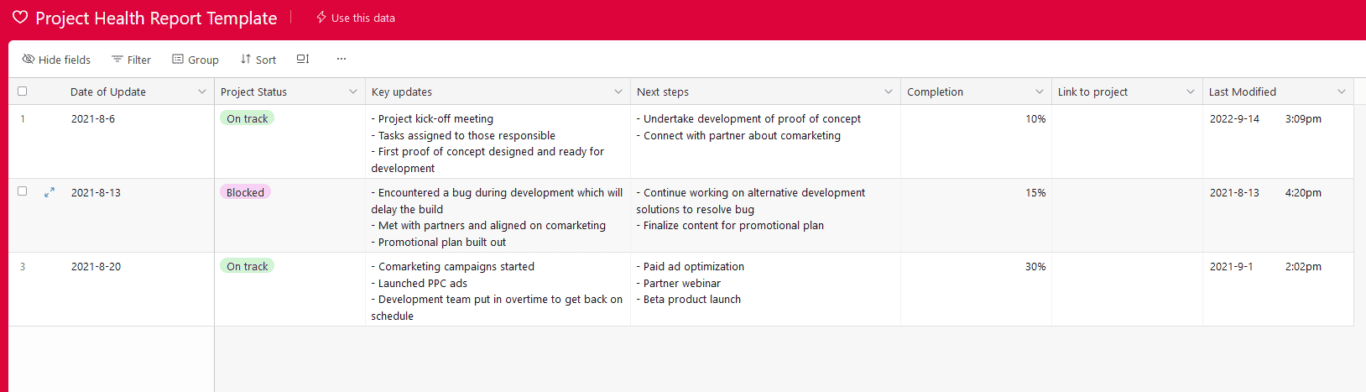
A project health report allows project managers to communicate whether a project is on track or going off the rails. With this Airtable template, you can do all that in one place — in a way you can easily automate, too. You can find more Airtable templates here.
Jira sprint report template for Notion
Creating a sprint in Jira helps you facilitate better planning, collaboration, and adaptability, enhancing overall team efficiency and project success. Jira is a great tool for tracking work on software projects, but it’s not always the best way to communicate that work. If you’re already using Notion in other aspects of the business, you can use this template to do that — and a tool like Unito to get your data there in the first place.
Using Unito for automated reporting
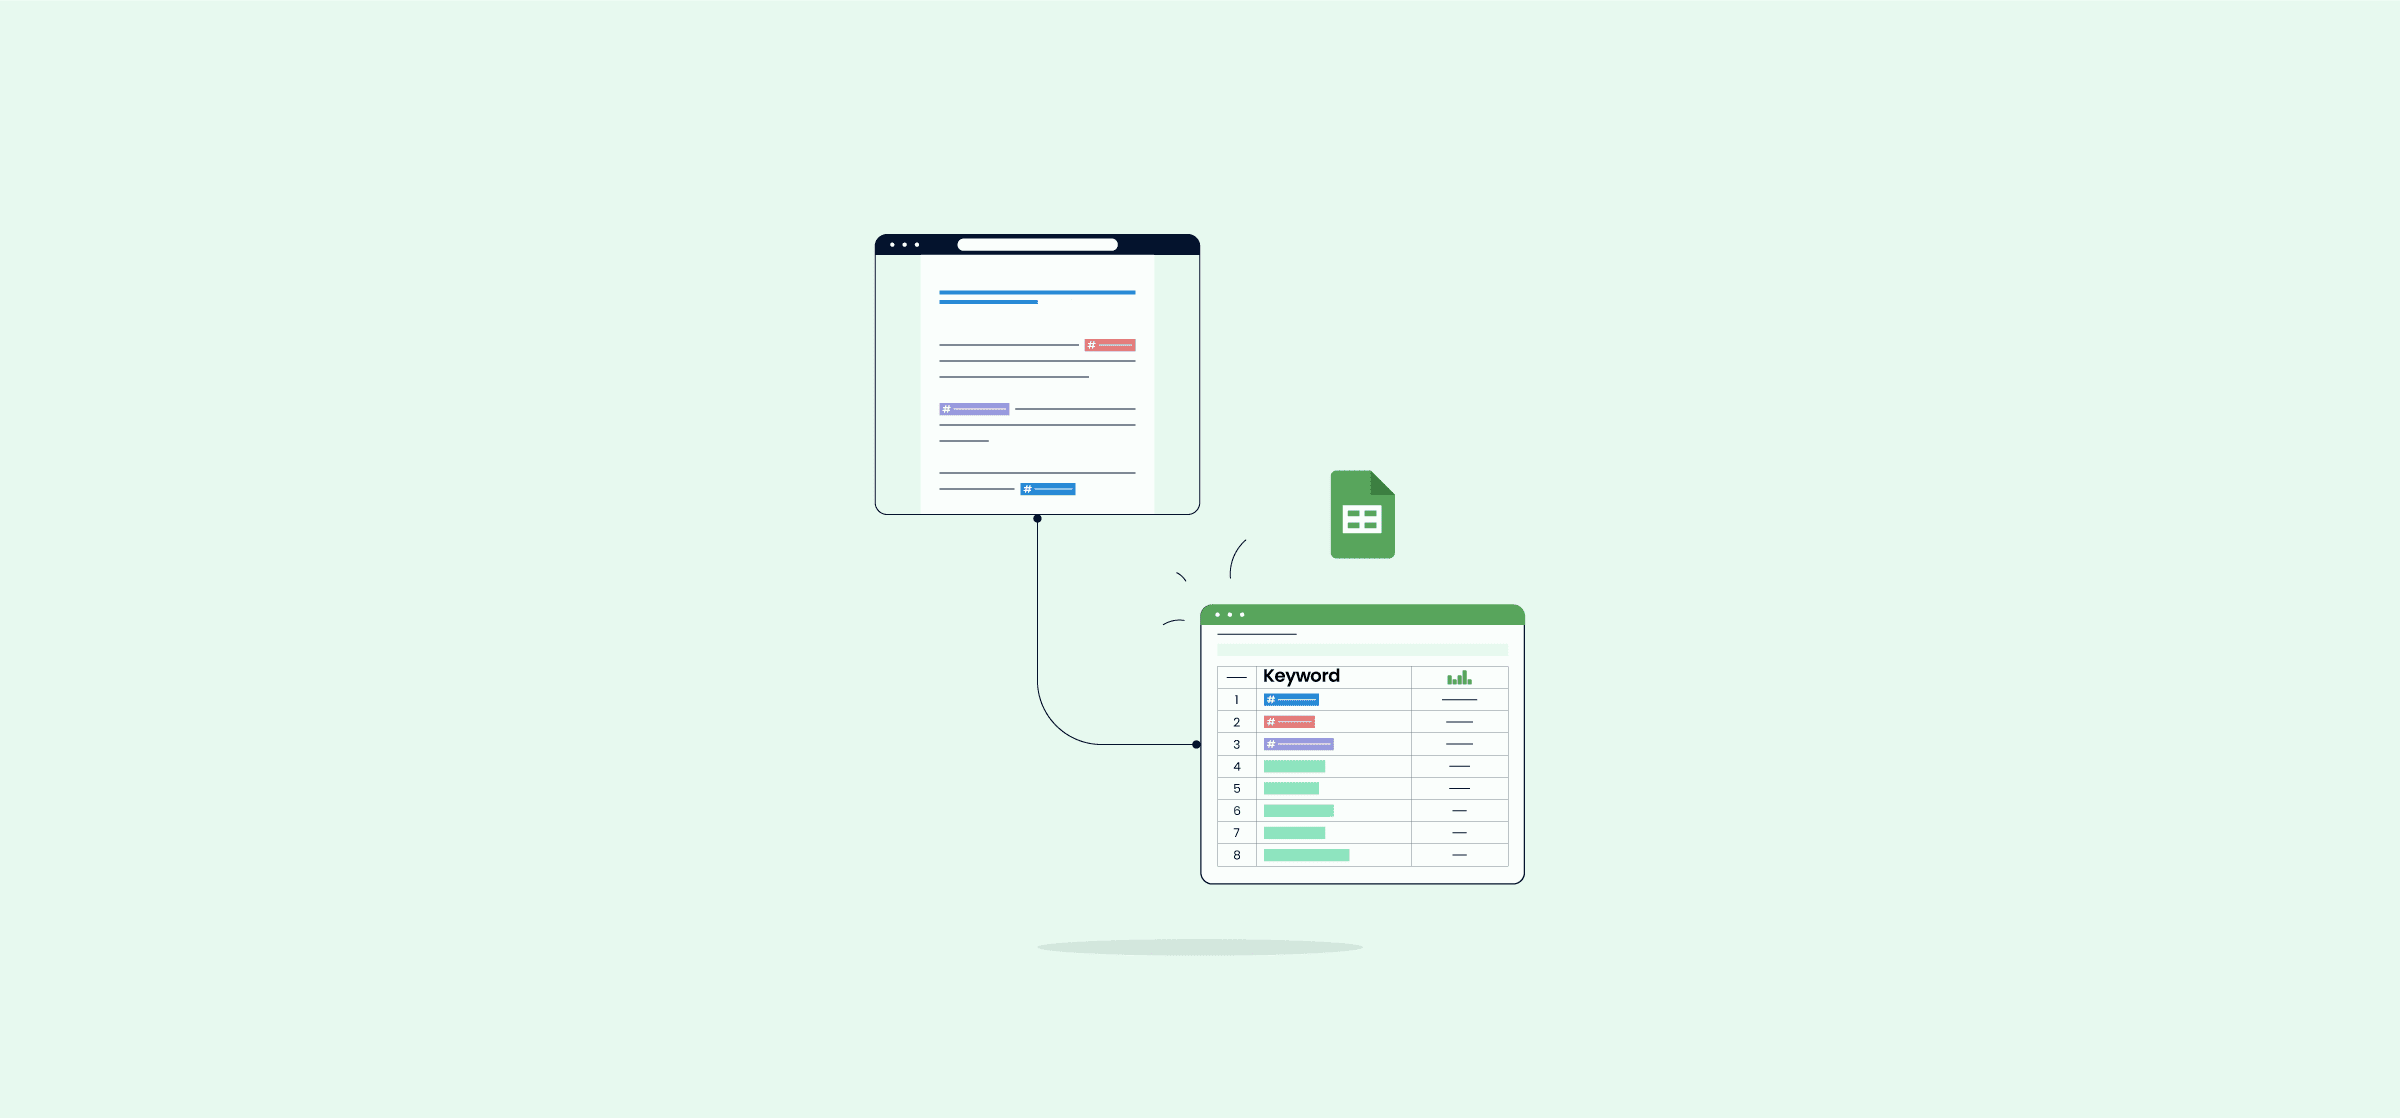
Unito is a no-code workflow management solution with some of the deepest two-way integrations for the most popular tools on the market, including Google Sheets, Microsoft Excel, Asana, Trello, Jira, Notion, Airtable, and more. With a Unito flow, you can automatically export data from any of Unito’s 30+ integrations to a spreadsheet and keep everything in sync. It’s the lynchpin for your automated reporting workflow, no matter what tools you’re using.
Want to see how it works? Check out these full guides to using Unito to automate your spreadsheets.
- How to Automate Google Sheets with Live 2-Way Updates
- How to Sync Airtable with Microsoft Excel
- How to Sync Airtable with Google Sheets
- How to Easily Export ClickUp Tasks Into Google Sheets
- How to Sync Asana to Microsoft Excel Automatically
- How to Export GitHub Issues and Pull Requests to Google Sheets Automatically
- How to Export Google Contacts to a Spreadsheet
- How to Connect HubSpot with Google Sheets
- How to Sync monday.com Tasks with Microsoft Excel
- How To Connect Trello with Google Sheets
- How to Sync Wrike with Microsoft Excel to Speed Up Reporting
Keep things automated
Automated reporting makes everyone’s life easier. Those who build reports can do it in less time — and with less work — and those who typically request them can get reports faster. Sometimes, they’ll get them even without asking. You don’t need a huge tool stack or a massive budget to automate your reports, just a spreadsheet and an integration solution like Unito will do.