
Sales Reporting: What It Is and How To Do It
Sales reporting is an essential part of running any successful business. Without accurate sales reporting, it would be near impossible to know whether a company is generating enough income to succeed, how a sales team is performing, where improvements can be made, and where to take the business next.
In this post, we’ll explain exactly what sales reporting is, why it’s important for your business, and how to actually create an effective sales report.
What is sales reporting?
To put it simply, a sales report is a cumulative record or document of a company’s sales data from a specific time period. This could be something like a recurring monthly sales report, a quarterly sales report, or an ad-hoc time period that’s most helpful to understanding the health of your business. A sales report can also be tailored to include information that is relevant to a particular department or stakeholder.
For example, a marketing director may request a sales report to see whether a lead magnet their team created is generating any actual results for the sales team. If the lead magnet the marketing department created isn’t getting the desired results or generating any useful leads or sales, the marketing team could decide to reduce the time spent on initiatives of that nature in the future.
When it comes to what a sales report actually includes, the answer can vary. A typical sales report usually includes details and info like the number of sales made, the total revenue generated during a specific time period, the average sale price, opportunities and pipeline information, and the sales team’s performance. In addition to this key data, they can also include other important KPIs, such as customer retention rates, conversion rates, and customer satisfaction scores.
All of these metrics can help businesses understand not only how the business is performing from a strictly financial point of view, but how their sales efforts are impacting customer satisfaction and loyalty.
Why is sales reporting important?
Usually completed by a sales manager or team lead, sales reporting provides valuable insights into the performance of a company’s sales team. This can help businesses identify areas for improvement and growth.
Let’s take a closer look at the key benefits of sales reporting.
More closed deals
The goal of any sales team? Close more deals. While getting more leads and taking more meetings are usually the key to getting more sales volume, sales reporting plays an important role as well.
Reports allow leaders to get more visibility into their sales funnel, quantifying their team’s efforts at every stage of the process. That increased visibility allows them to know exactly which problems they need to solve to help their teams close more deals. They can test new initiatives, see the results in their reports, and keep changes that have the most positive impact.
More visible trends and patterns
Sales teams and managers can use sales reports to find trends and patterns that improve their productivity and results. They can identify the activities that are bringing about the best results and increase the time and energy spent in those areas—while decreasing or eliminating the activities, strategies, and behaviors that are not producing positive results.
For example, if a sales representative is finding that sending a follow-up email after a discovery call is increasing the number of closed sales by 14%, the team can test this theory and start implementing this as a best practice. On the other hand, a sales report might reveal that the company’s cold-calling strategy is backfiring—information that could help make the case for pulling back on this kind of approach in the future.
By tracking and analyzing information and data on sales metrics, sales managers can make informed decisions that drive growth, boost efficiency, and maximize revenue.
Less micromanagement
When others across the organization aren’t able to get a clear picture of the sales team’s performance, it’s much more likely that they’ll double down and attempt to gain more control and insight through micromanagement tactics. When sales reports are created and shared proactively, those across the business can get a clear and transparent look into the company’s sales performance and feel in control, without excessive communication with the sales team lead.
By providing everyone across the business — including the sales team’s manager — with a clear picture of how the team is performing, sales reporting helps eliminate the need for managers to constantly check in with the sales team and monitor their progress—something that everyone is sure to appreciate.
Improved tracking against goals
A sales team needs clear goals in order to get the best results possible. Individuals who set goals are ten times more likely to achieve them and succeed, something that experts say applies to businesses as well.
Sales reporting helps organizations establish goals and achieve them. By comparing and analyzing sales data across reports, businesses can identify areas where they’re not hitting those objectives. With this information, sales managers and other decision-makers can make adjustments to their sales strategy.
Eliminating bottlenecks in your sales funnel
A sales process is essentially a series of levers teams can pull to acquire more customers. These levers correspond to the stages of the sales cycle:
- Prospecting
- Making contact
- Lead qualification
- Lead nurturing
- Offer
- Overcoming objections
- Closing the sale
If you know at which stage of the sales cycle you lose the most deals, you can pull those levers to turn things around. Sales reporting is what gives you that information. With the right sales reports, you might learn that your leads aren’t being qualified appropriately — or quickly enough — allowing you to focus your efforts on improving this.
A step-by-step guide for sales reporting
Now that you understand what sales reporting is and why it’s important to your business, it’s time to actually write a sales report. While there are many different formats and methods for creating a sales report—along with different types of sales reports—we’ll be exploring an essential report structure that can get you started.
Here’s a high-level step-by-step guide to writing a sales report.
Step 1: Understand your audience and purpose
Just like a writer will fine-tune their content for their audience, a sales report should be created with a clear purpose in mind.
Some questions to ask when building a sales report include:
- Who is this report for? What do they need to know?
- What is the report trying to show?
- What time period should be covered? (ie. daily, weekly, monthly, quarterly, annually, etc.)
- What information needs to be included? What can be left out?
Asking these questions can help you focus the content of your report to ensure it’s as relevant to your audience as possible.
Step 2: Gather your data
Once you’ve established the key purpose of the report and your target audience, it’s time to gather the data your report needs. This can include but is not limited to: sales figures and results, the value of specific deals in the pipeline, the number of calls completed by your team, leads generated, customer satisfaction scores, customer demographic patterns, the impact of specific marketing campaigns, and/or individual salesperson performance.
Depending on your industry, your sales data can be gathered from your CRM software (e.g Salesforce), point-of-sale (POS), systems, the marketplace platform your team uses (e.g. Shopify), or other sales records and documents.
Step 3: Build an outline
Now that you understand who you’re creating your sales report for and why, you can create a general outline for your report.
This could be as simple as:
Section 1: Intro and purpose of the report
Section 2: Data findings
Section 3: Insights and analysis
Section 4: Next steps
Section 5: Conclusion
As soon as you’ve established a basic sales report structure, you can start filling in your sections with the relevant information and visuals.
Not sure where to start? Here are some sales report templates that’ll give you a headstart.
Step 4: Create visuals
Visuals offer an effective and engaging way of presenting information within a sales report. According to research conducted by 3M, “visuals are processed 60,000 times faster than text, which means you can paint a picture for your audience much faster with an actual picture.”
While a simple spreadsheet is enough for some sales reports, most will benefit from visuals, like charts, graphs, infographics, and tables. For example, you could include a chart to show the overall high-level sales team performance over a certain period of time, or a line graph to show next year’s sales forecast.
Some of the tools you use for building reports will have built-in features for doing this, but you can also use a separate infographic maker or chart builder.
Step 5: Capture and share insights
After you’ve added your data and visuals to your sales report, you’ll need to include a section with key insights that arose through the data analysis process. Without this crucial component of the sales report, the information presented doesn’t have any further impact or meaning.
For example, if after examining the data you recognize that there was a sharp decline in sales during a two-day period in October, you can explain that your CRM software had an outage that impacted your team’s ability to close deals at that time. Alternatively, you can identify overall patterns such as an increase in sales at a specific time of day or with a specific sales rep, a boost in sales when new features of your product are launched, or a decrease in sales during the time period immediately following a product or membership price increase.
The data analysis and insights section of the sales report is an invaluable resource that helps the business not only understand its overall performance but make better decisions in the future.
Step 6: Conclude with next steps
Once you’ve written your report, incorporated eye-catching visuals, and provided your insights, it’s time to add a conclusion that specifies actionable next steps. This helps ensure your team stays on track and continues progressing toward departmental and overall business goals.
Here, you can identify areas of improvement where your team can further optimize the sales process, assign responsibilities to specific team members, and set new deadlines and goals in order to keep the team focused, motivated, and accountable.
Sales reporting tips and best practices
Convinced that your sales team needs better reporting practices? Here are some tips for properly integrating this into your sales process.
Set a clear goal
If you just go from “we need some sales reports” to implementing the best sales reporting tool on the market without a plan, you won’t see much in the way of benefits. Before you start drafting a report — or building a process for regular reporting — identify your goal. Are you trying to get a high-level, holistic view of your entire process? Do you want to hone in on a specific part of your process? How often do you want to update your reports?
You’ll have to answer these questions so your sales team can have a well-defined reporting process.
Use consistent formats
For your reports to be useful — and stay useful — they need to have updated data. That means they need to be prepared regularly, which also means you need a consistent format. When reports are prepared manually, it’s all too easy to deviate from the format your teams expect. Whoever reads that report might then not have all the data they need, or they might just struggle to find that data if it’s in there.
Using a consistent format — or a template — makes reports easier to read and guarantees they have the data people are looking for.
Make your reports concise and easy to read
It’s tempting to pack your sales reports with as much data as you can and represent your entire sales process in a single spreadsheet. In practice, however, these reports become unwieldy and difficult to read, limiting the insights you can actually get from them. There’s a delicate balance between having enough data for your reports to be useful and not so much that it’s overwhelming.
Keep your reports as simple as you can without sacrificing essential data and you’ll get a lot more of your reports.
Use visuals
Tables and numbers can only get you so far. A good chart, graph, or even a sparkline can help leaders get a grasp of a report without going through every single row of data. Spreadsheets have tons of built-in ways to clean up your data and make it easier to skim, while dedicated sales reporting tools can automatically generate visual dashboards and charts with up-to-date data.
Use automation and reporting tools
Like any other kind of reporting, sales reporting takes a significant amount of manual work when it’s done using spreadsheets. That’s why most sales teams use tools like HubSpot or Salesforce to automate the grunt work out of their reporting. Even if you don’t have access to these tools, a simple automation platform like Zapier can help you save a serious amount of time.
6 sales reporting templates
Don’t want to write your own sales report from scratch? Here are some of the best templates for all sorts of tools, from spreadsheets to project management tools — and even all-in-one tools like Notion and Airtable.
Sales performance report for Excel
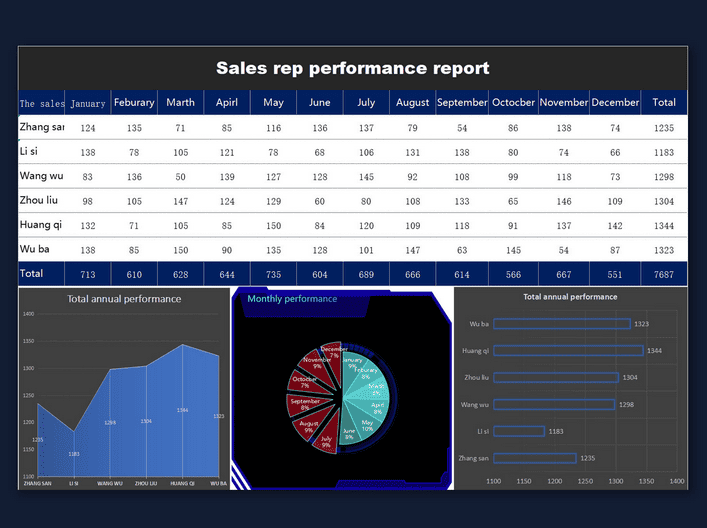
With this template, you can track how your sales team is performing and match it up with your goals. This gives sales leaders the ability to know how the team is contributing to the business’ growth at a glance. Because that performance is split up across salespeople, you’ll also know if anyone’s not meeting their goals.
Service sales reporting template for Google Sheets
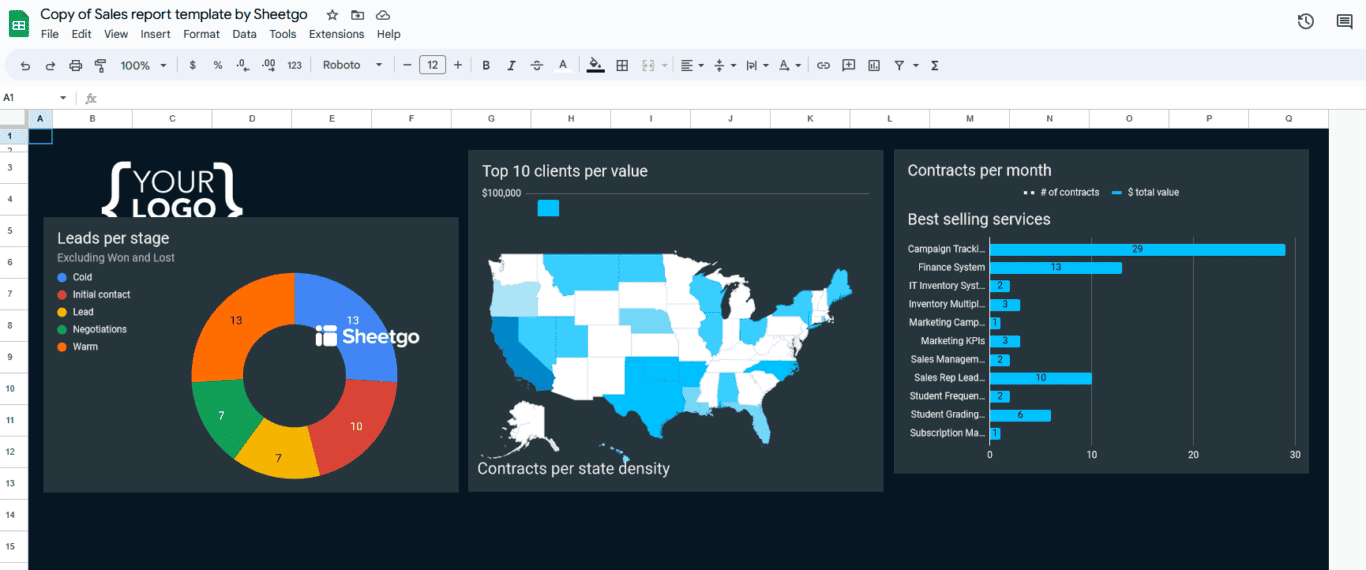
If you’re using Google Sheets, this might end up being your template of choice. This template includes a dashboard and databases for leads, clients, and contracts. This gives you everything you need to quickly track performance and crunch some data for important sales initiatives.
Contract and Invoice OS template for Notion
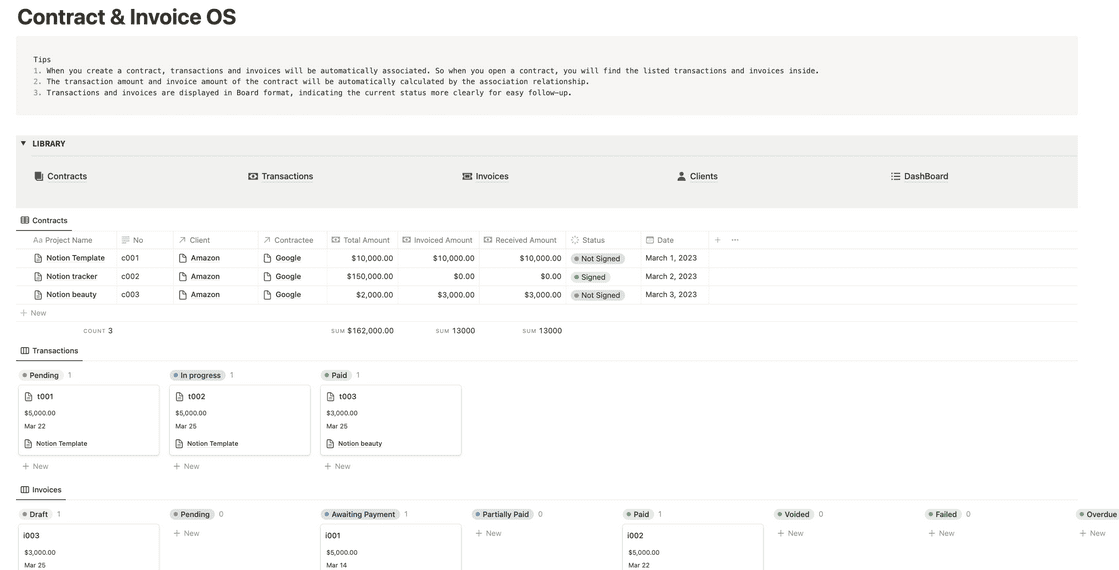
If you don’t have a tool dedicated to tracking invoices, payments, and contracts, you’ll need a template like this. A sales team that uses Notion can go in to quickly review contracts and invoices, and use that data in other reports.
Sales CRM dashboard for Airtable
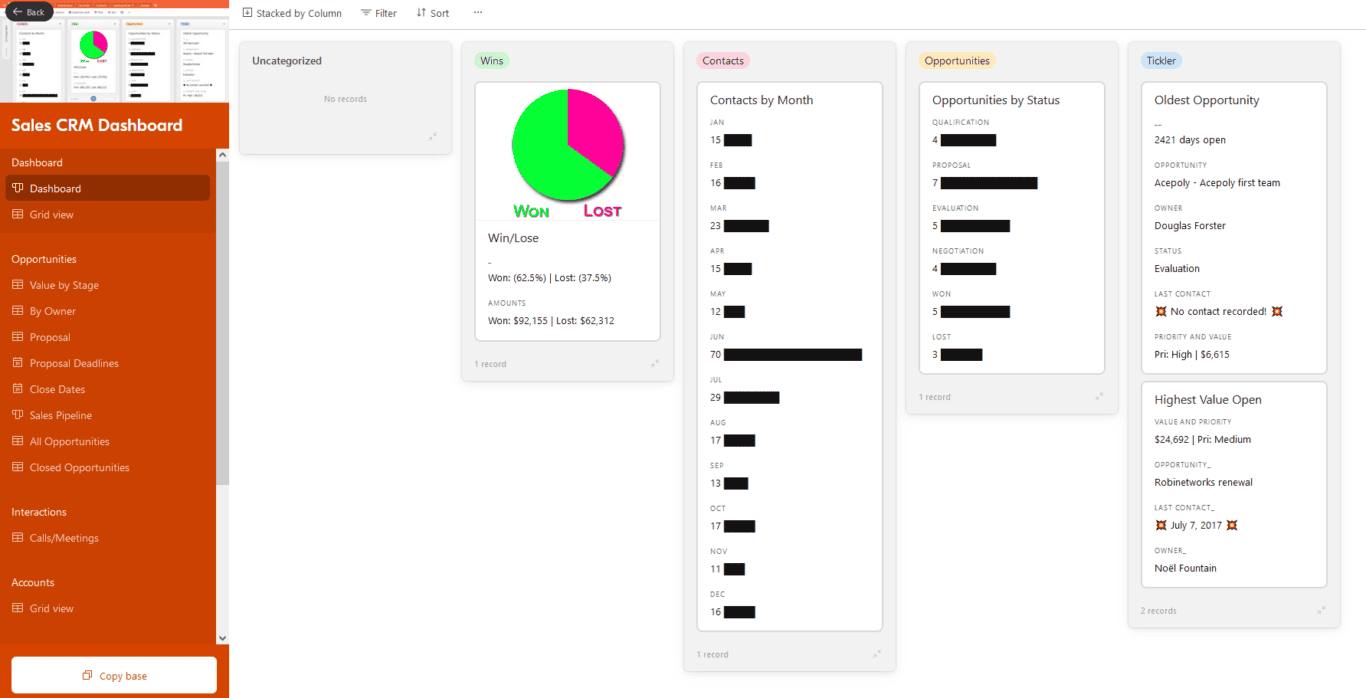
Are you using Airtable? If you’re not ready to spring for an expensive CRM tool, you can use this template to track your sales team’s performance, the deals they’re closing, and find opportunities for potential sales initiatives.
Monthly sales report template for Google Sheets
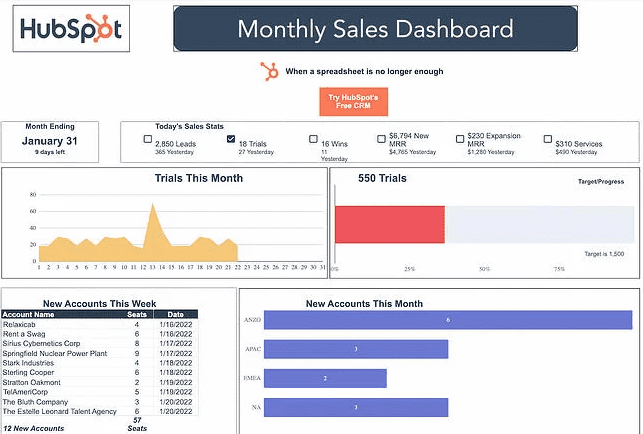
With monthly reporting, sales leaders can keep track of their team’s performance to know what needs to happen so everyone can hit their goals. With this template for Google Sheets, you’ll get an idea of how many new accounts have closed, how many leads your team is working with, and more.
Quarterly sales report for Excel
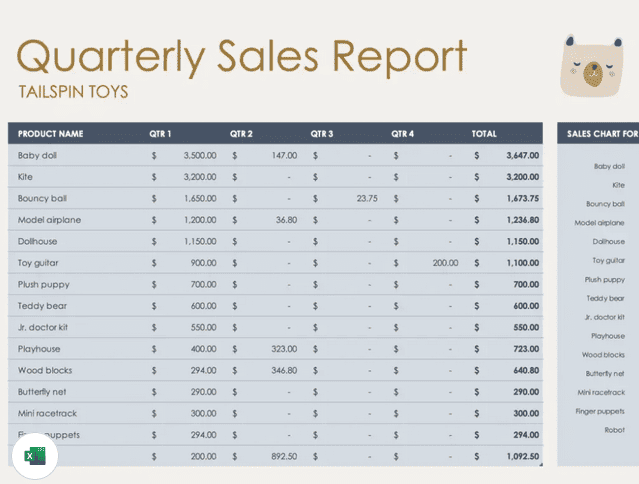
Need to report on your quarterly sales goal? This template for Excel will give you a simple way to do that, breaking down revenue by product and by quarter. It’s a nice, simple way to share data with the team or other stakeholders.
(Sales) Reporting Live!
No matter the size of your business, taking the time for regular sales reporting can help you to better understand and sell to your customers, optimize your sales process, motivate your sales team, and drive continued growth and success.