Build Dynamic Progress Reports With Google Sheets and Unito [TEMPLATE]
Ever get a request for a progress report just as you’re wrapping up at the end of the day? Or maybe there’s an urgent board meeting coming up and you have to put all other tasks aside until all your reports are in order? Whatever your role, you’ve probably run into a situation that involved hours spent building manual reports that might only be valuable for a couple of minutes. But that doesn’t have to be the case. That’s why we built a template for Google Sheets you can use to create dynamic progress reports that stay up-to-date automatically.
Here’s a breakdown of the report, the template, and how you can use Unito to cut down on the amount of time spent building progress reports each week.
What is a progress report?
A progress report communicates how much has been done, what still needs to happen, and offers a preview of the next chunk of work that needs doing. Project managers and other collaborators use progress reports to keep stakeholders in the loop as a project moves towards the finish line.
Progress reports can be created as they’re requested, or on a regular timeline. For example, weekly or monthly progress reports are common. Progress reports often involve hours of work spent consolidating data from multiple sources and harmonizing it all into something digestible.
But with the right tool — and the right template — it’s possible to build a progress report that’s dynamic, requiring just a bit of manual revision every time it’s due. And if you use Unito, you don’t even have to do that. More on that below.
Why Google Sheets and Unito?
Google Sheets is a powerful spreadsheet tool that’s part of the Google Suite. It can be used for building reports, databases, and even managing projects. Here are just a few reasons why Google Sheets is a great choice for progress reports:
- It’s free: Because it’s part of the Google Suite, Sheets is completely free to use.
- It’s everywhere: By some counts, Google Sheets has twice as many users as Microsoft Excel. That means reports built in Sheets are compatible with nearly every tool stack.
- It’s powerful: Google Sheets has a number of features that make it one of the best reporting tools out there. The fact that it’s built for collaboration is also a big plus.
Unito is a no-code work tool integration platform with some of the deepest two-way integrations on the market. In just a few minutes, you can build flows that sync crucial information between the tools you’re already using. That means you can turn a static spreadsheet in Google Sheets into a dynamic report that’s automatically updated as work happens in other tools.
In Unito’s Report on Reporting, 37% of respondents said they spent at least three hours a week on reporting. With the right tools, you can cut that time down to minutes.
How the progress report template works
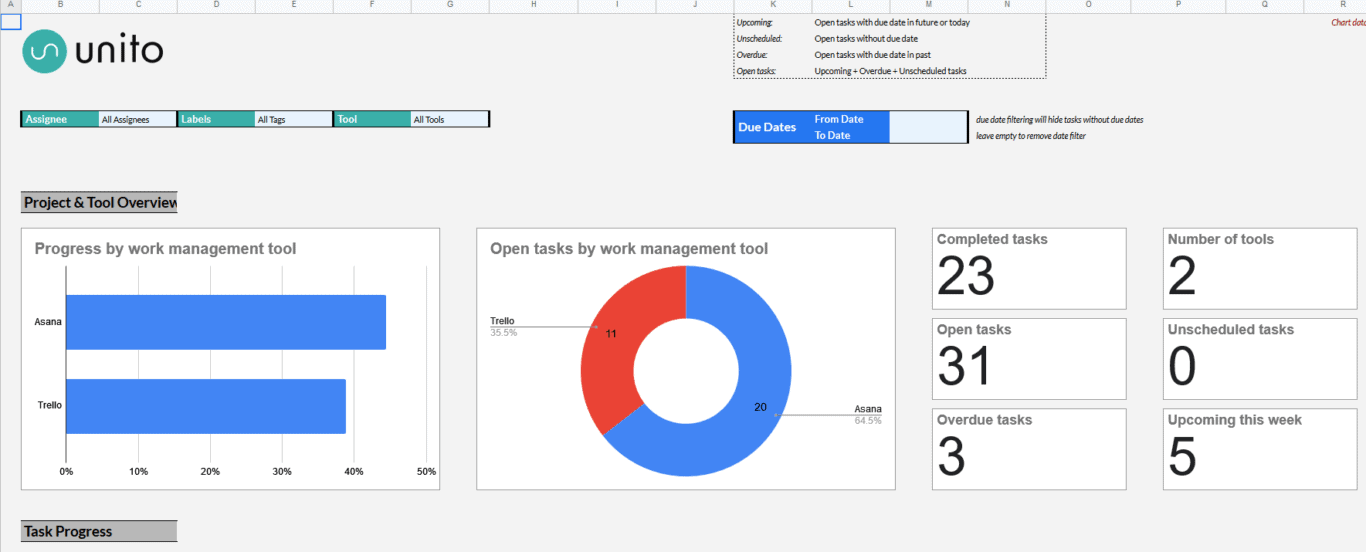
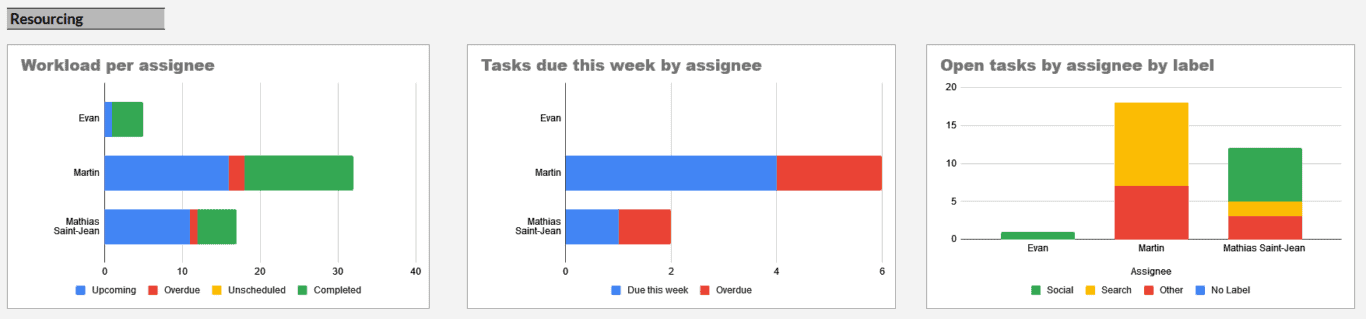
The progress report template for Google Sheets takes information out of your work tools and turns it into a visual representation of how your project is going. You’ll find charts that track workload for each collaborator, task progress in each tool, and more.
To get access to this template, go to this link and make a copy of the sheet so you can make changes. Then, when you open the template, you’ll find these five tables:
- Instructions: This table gives you an overview of how the template works, as well as instructions for using Unito with it.
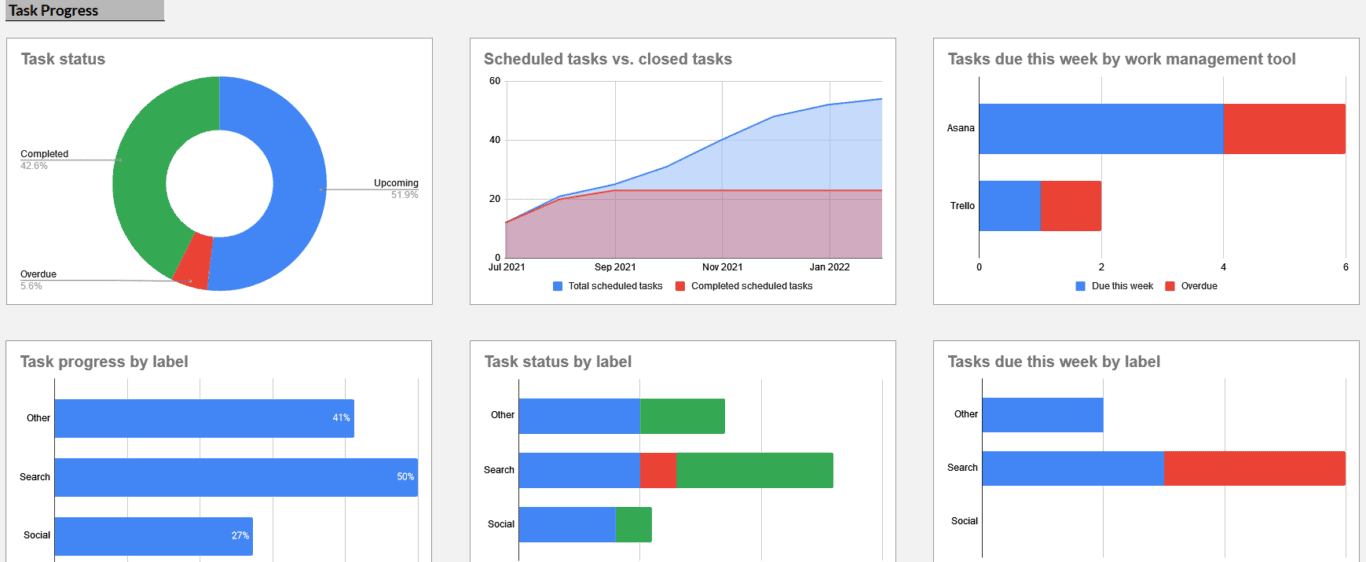
- Project progress report: This is the star of the show, the table where the actual reporting happens. It’s where you’ll find the charts and graphs built for tracking your project.
- Task statistics: In this table, you’ll find every piece of information you need to know about the tasks you’ve synced to this report.
- Sprint sorting: When syncing Jira issues, you can use this table to keep track of your sprints.
- Data dump: All data from your work tools will be synced to this table, where it will feed the charts and graphs in your report. You’ll see example tasks in this table, which you’ll need to remove when you use the template.
When task information is added to the data dump table, it’s automatically fed into the progress report table, where it’s used to populate the graphs and charts there.
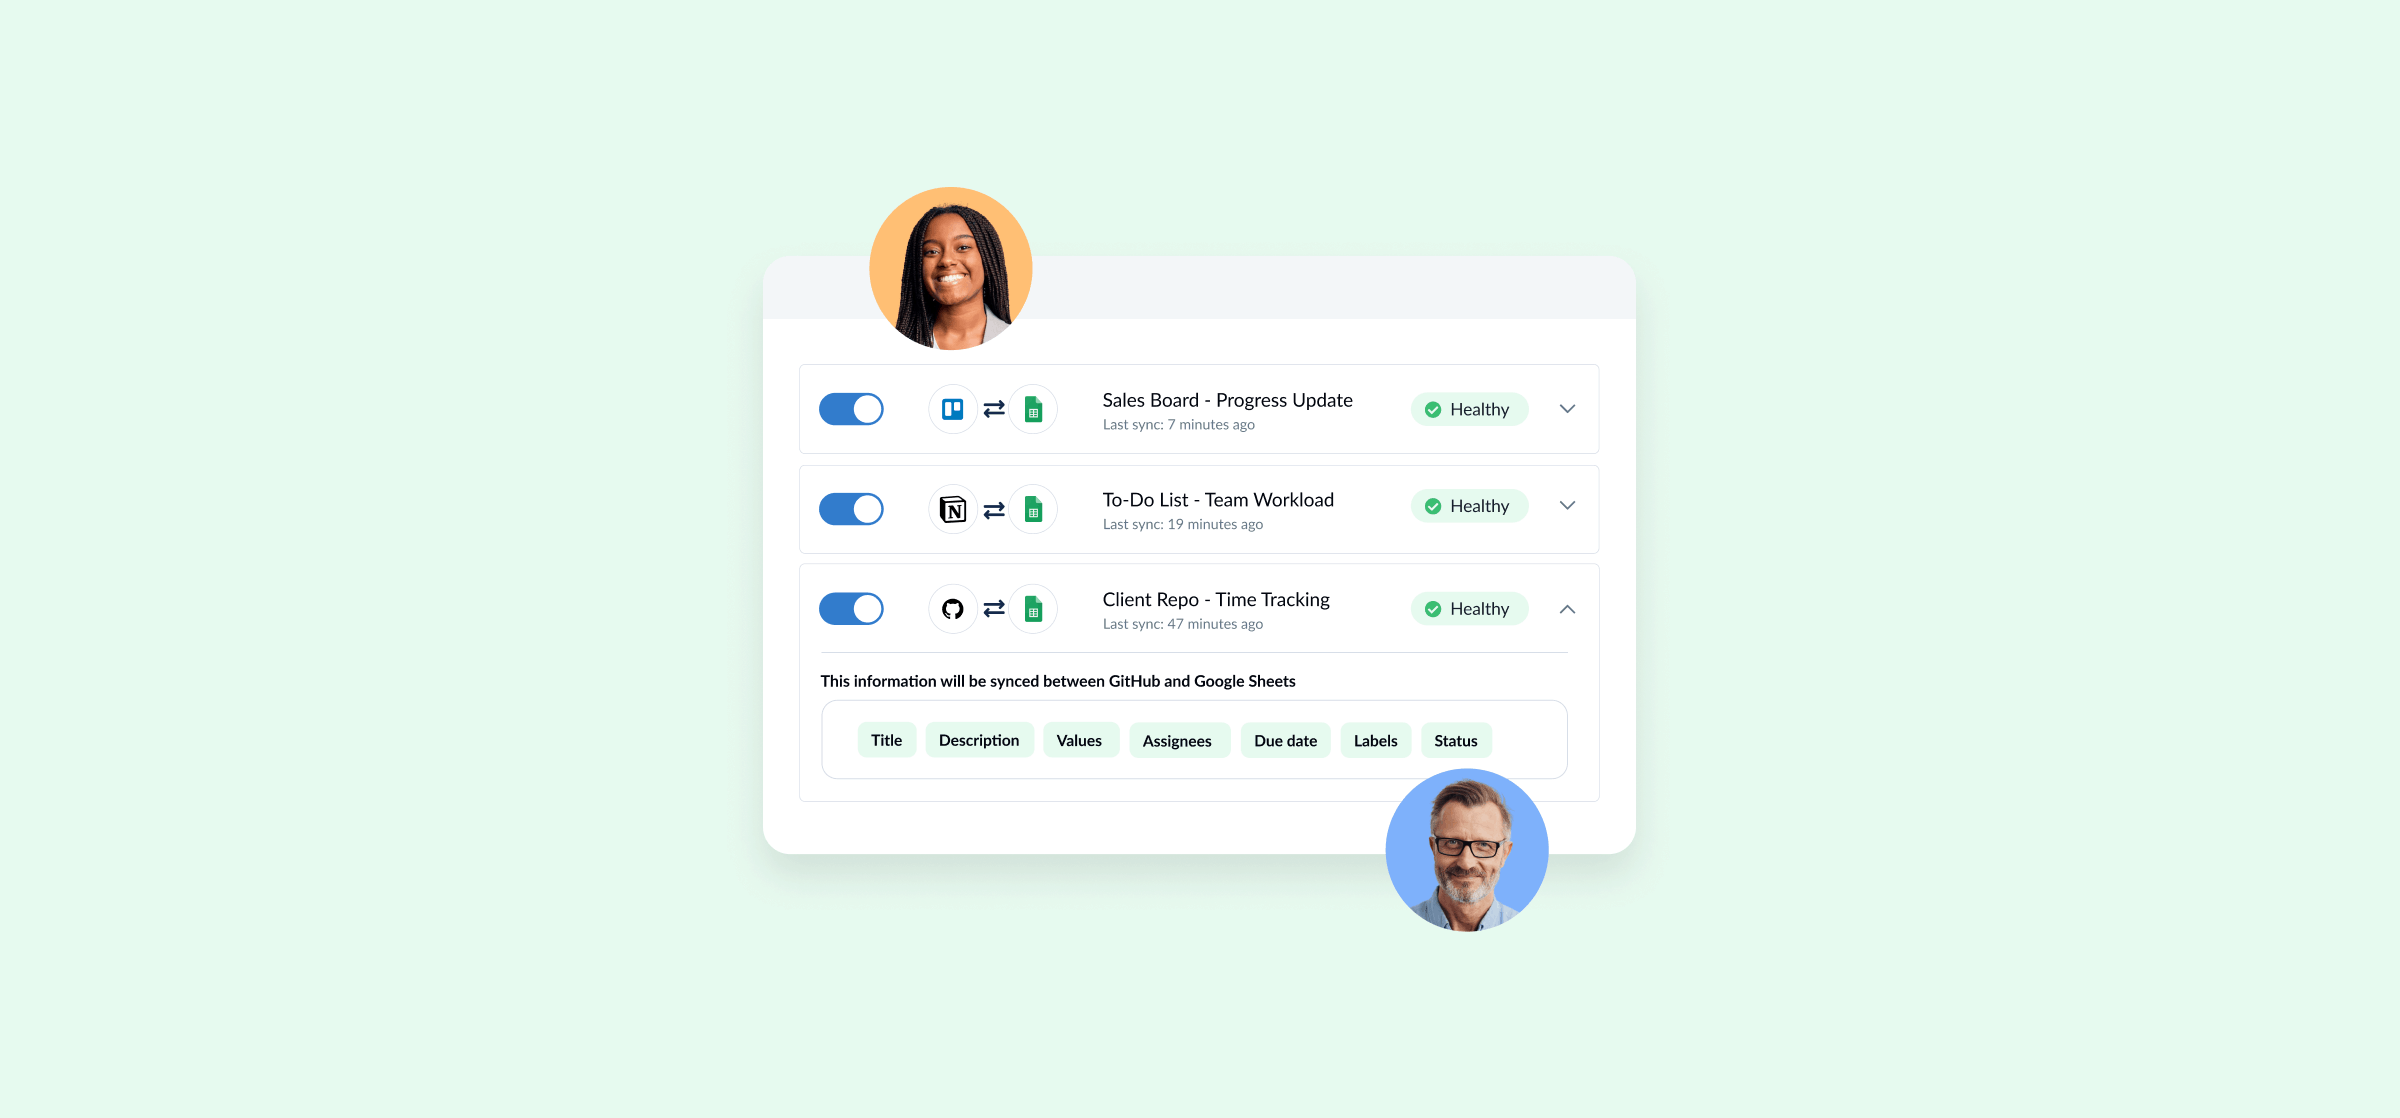
How to populate your report automatically with Unito
Before you can use Unito with Google Sheets, you’ll need to install the Unito add-on. You can find instructions for doing that on our Help Center. Once that’s done, creating a Unito workflow for this template is super simple.
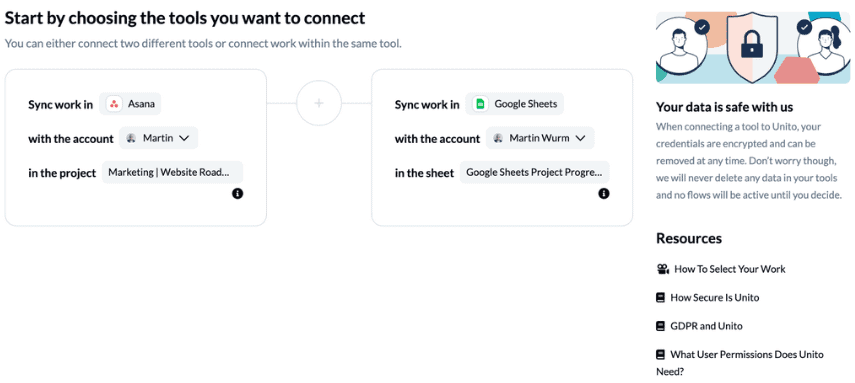
Start by picking the blocks of work you want to connect. On one side, you’ll want the sheet you’re using for this template and choose the Data dump table. On the other, pick the work tool with the project you’re reporting on. Note that, if you’re using multiple tools for this, you’ll need to create a flow for each one.
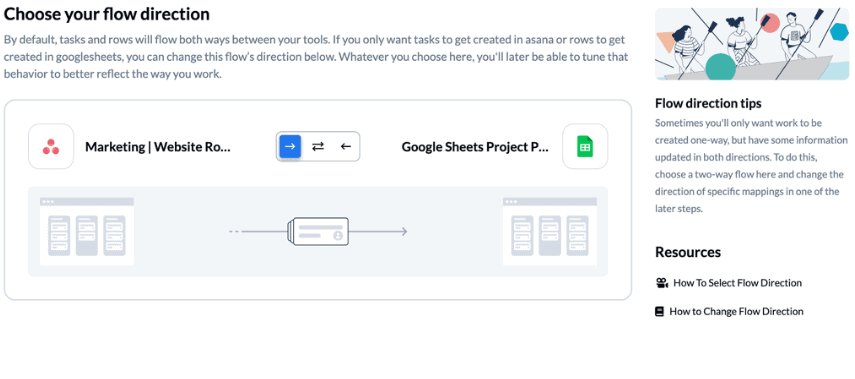
Next, you need to set flow direction, which will set the direction data is synced across tools. For this use case, you want to set a one-way flow, with data flowing from your secondary work tool to Google Sheets. If you had a two-way flow, the information in the Data dump table would sync back to your work tool. You don’t need that for this to work.
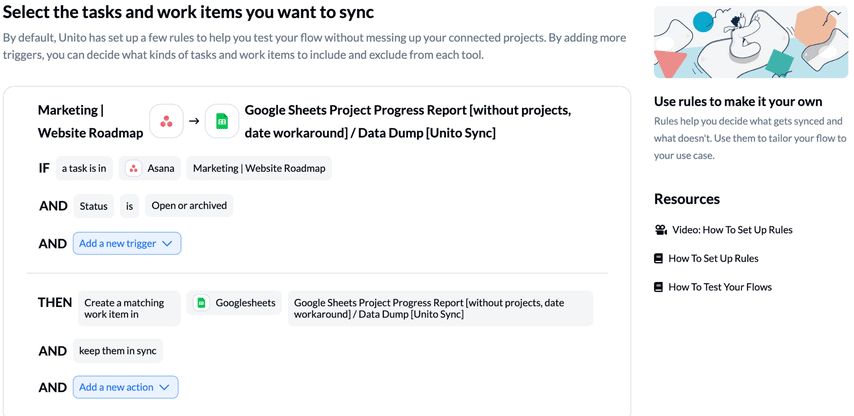
After that, you can use rules to determine how much information gets synced from your other tool back to Google Sheets. You don’t need any specific rules to make this template function, but setting up the right rules can help you tailor the flow of information to your use case. Maybe you only want tasks with specific assignees synced to your report? Or maybe there’s a specific label that identifies work from a certain project? It’s up to you.
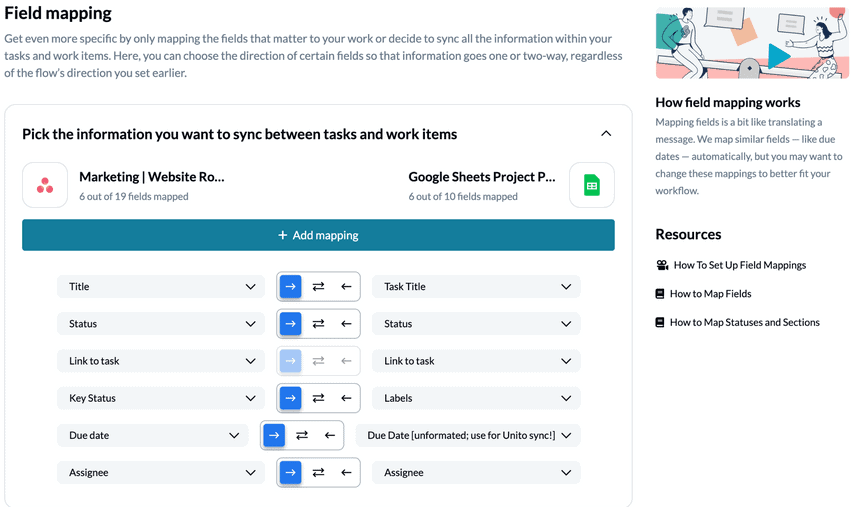
Now it’s time to set up field mappings. Mappings help Unito translate information from one tool into something that will make sense for the other. That’s done by building relationships between the fields in each tool. Make sure to follow the field mappings below to get this template working right. Note that the exact names of the fields may be a bit different depending on the tool you’re using.
After that, you’re all set! Launch your flow, and watch as Unito automatically populates your Google Sheet with data from your other work tool. Graphs and charts will start ticking up to reflect progress in your work tools, and stakeholders will have a dynamic report they can check at their convenience.
Using this template with Google Data Studio
Building an automated progress report in Google Sheets is one thing, but what if you want to use Google Data Studio, too?
You’ll want to start with this Google Sheets template, which is a little different from the one found above.
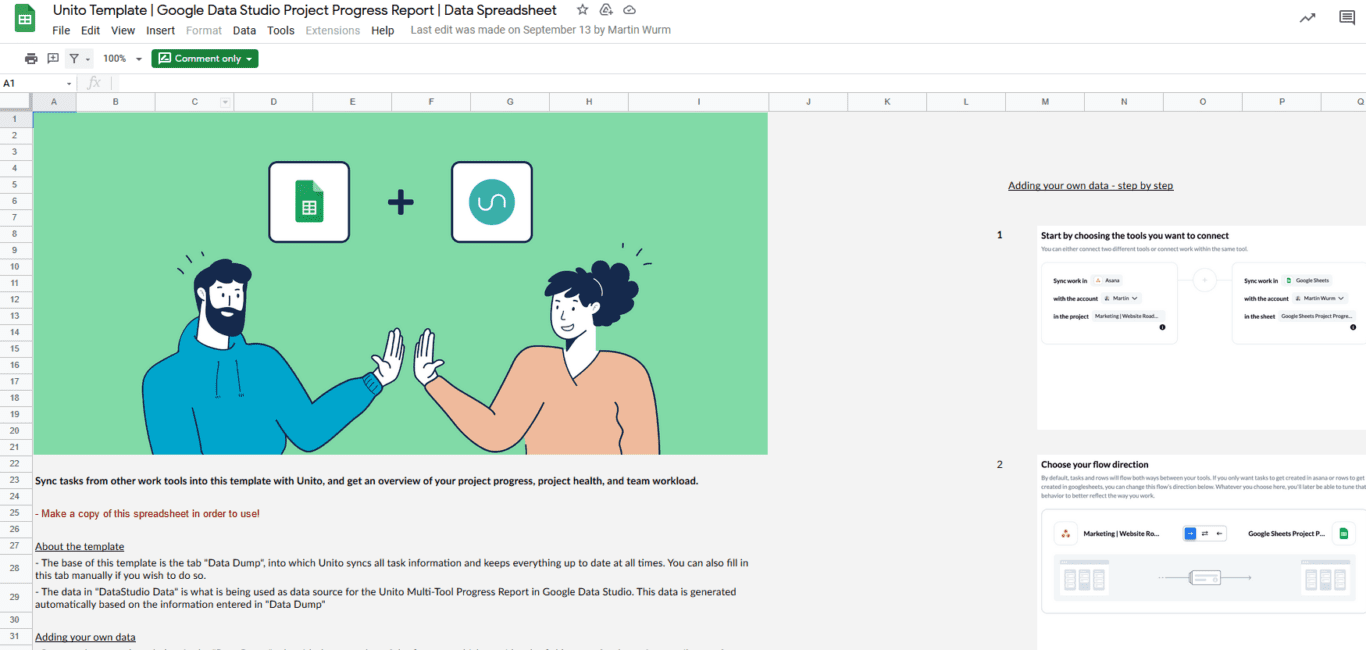
This one is built for integration with Data Studio, so it doesn’t have any formulas or graphs. Essentially, it serves as the data powerhouse you’ll use to visualize your information in Data Studio.
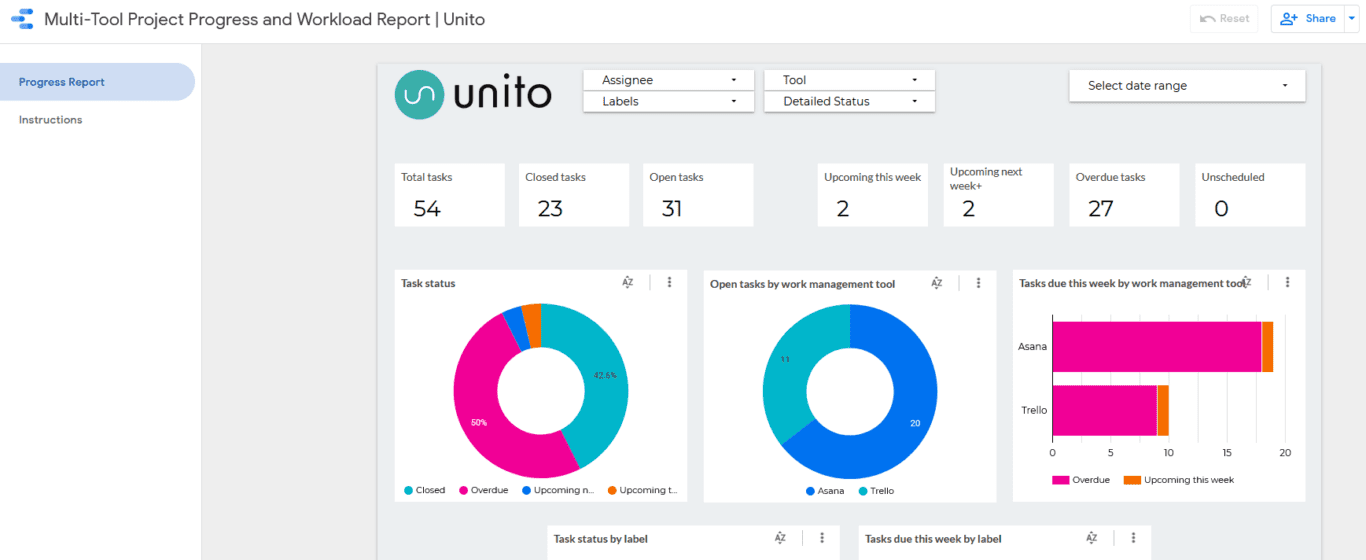
Build a Unito flow in the same way you did above, and you’ll sync information from your work tools, such as Salesforce, to Google Sheets. Then, just copy this Data Studio template, go to Resources, then Manage added data sources. Add your spreadsheet as a data source, and the charts in Data Studio will be automatically updated with your data.
Ready to get more out of Google Sheets?
Only Unito's Google Sheets integration can power dynamic progress reports that are updated in real time.