
Build a Jira Reporting Dashboard in Google Sheets With Unito’s Free Template
Your software team’s work is absolutely vital to your business. But developers and product managers often use tools built with their expertise in mind, tools that don’t always overlap with what other stakeholders are using. When that’s the case, someone usually has to build manual reports to keep everyone else in the loop.
With the right tools, these reporting workflows don’t have to come with headaches and hours of manual work. Here’s how you can use a free template for Google Sheets — and a Unito flow — to automatically build Jira dashboards.
Built-in Jira dashboards vs. custom Jira dashboards
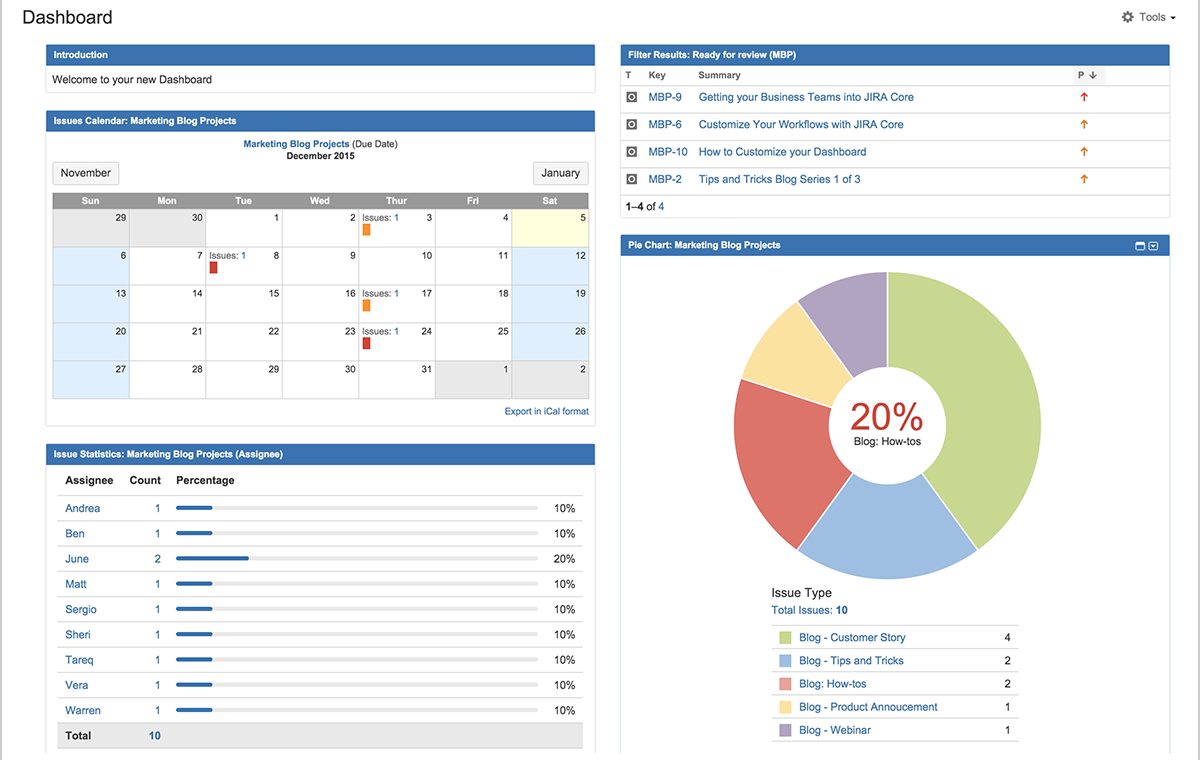
Jira allows users to build detailed dashboards fed with data from Jira projects. Pie charts, burndown charts, lists, calendars, and more can all be brought together into a single page product managers, team leads, and other stakeholders can use to get visibility on Jira projects at a glance. They’re customizable, they’re thorough, and for many teams, they’re more than enough for their needs.
That said, Jira’s built-in dashboards aren’t necessarily your best option in all situations. They might not be well-suited to sharing a project’s status with your entire organization, external collaborators, or less technical teams. In these situations — and others — you may instead want to build your own custom dashboard in a separate tool. You can use a tool like Google Sheets for this, since most professionals know how to use it and are comfortable building dashboards and reports in it.
But what if you don’t have to build this dashboard yourself?
How to build Jira dashboards with this template
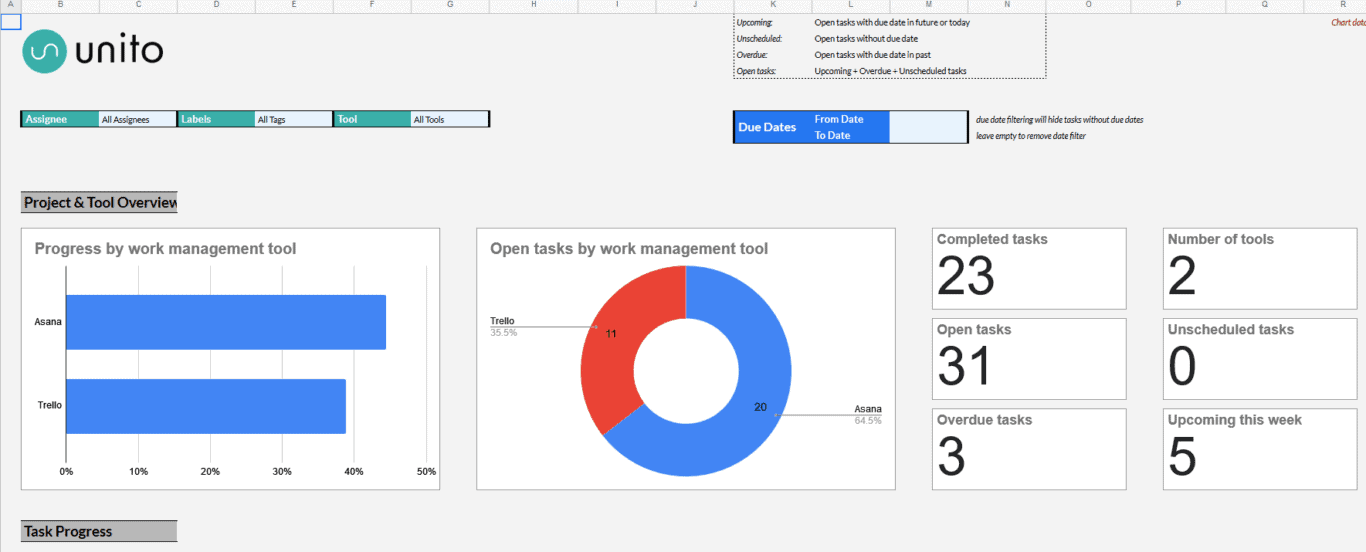
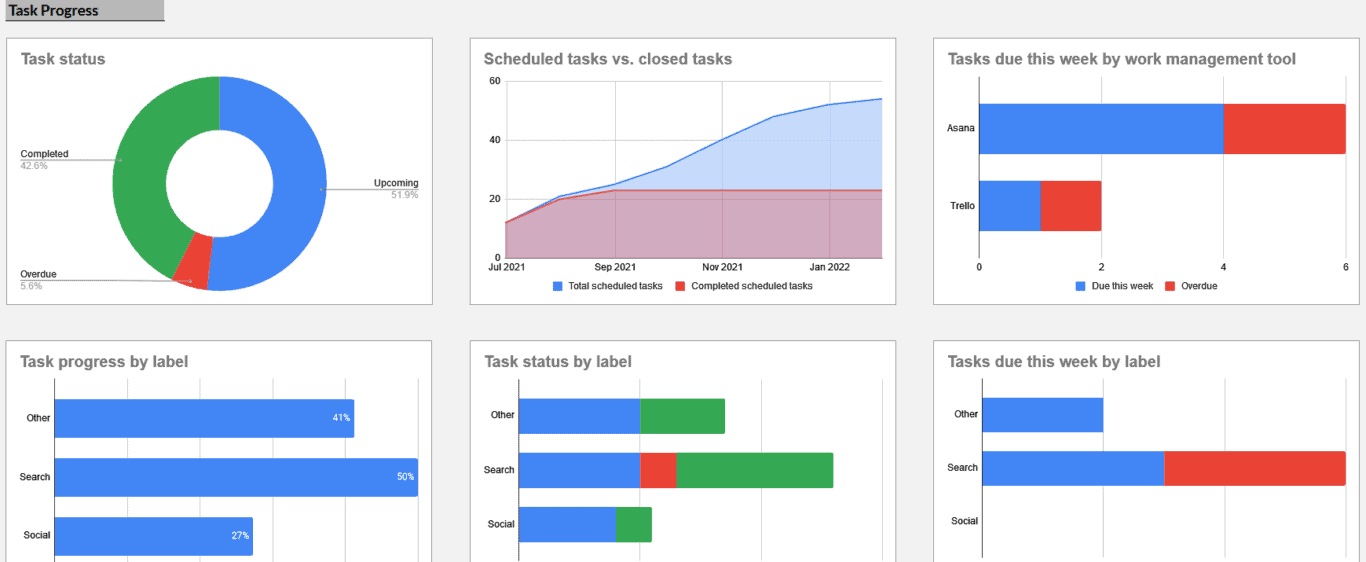
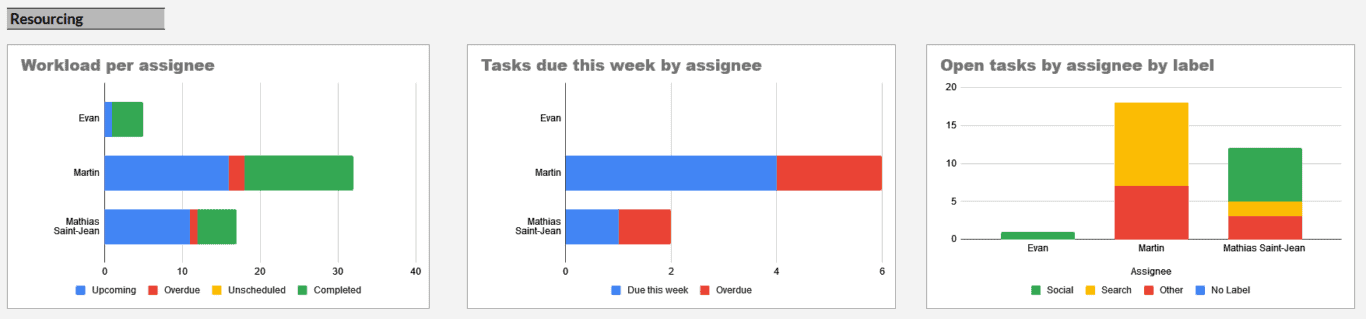
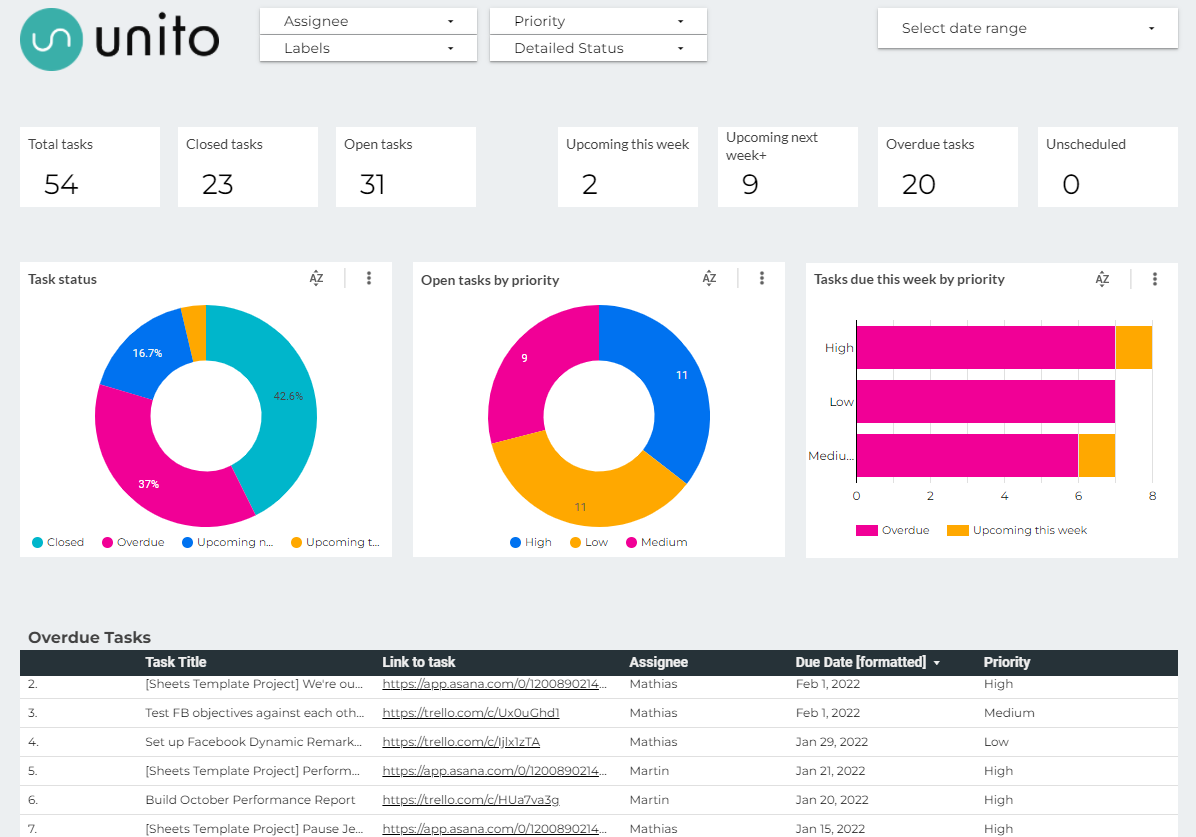
Our progress report template for Google Sheets pulls Jira data out of your projects and represents it visually so you can quickly tell how a project is going. The charts track the workload of individual collaborators, task progress by tool, and more.
You can get this template here and make a copy for your own report. You’ll find these five sheets in the template:
- Instructions: This table gives you an overview of how the template works, as well as instructions for using Unito with it.
- Project progress report: This is the star of the show, the table where the actual reporting happens. It’s where you’ll find the charts and graphs built for tracking your project.
- Task statistics: In this table, you’ll find every piece of information you need to know about the tasks you’ve synced to this report.
- Sprint sorting: When syncing Jira issues, you can use this table to keep track of your sprints.
- Data dump: All data from your work tools will be synced to this table, where it will feed the charts and graphs in your report. You’ll see example tasks in this table, which you’ll need to remove when you use the template.
When tasks from multiple projects are added to the data dump table, the progress report table will be automatically updated.
Get the template.
How to fill your report automatically with Unito
The first step to using Unito with Google Sheets is installing the Unito add-on. You’ll find detailed instructions for doing that in our Help Center. Once that’s done, you can build the flow that makes this template work in just a few minutes.
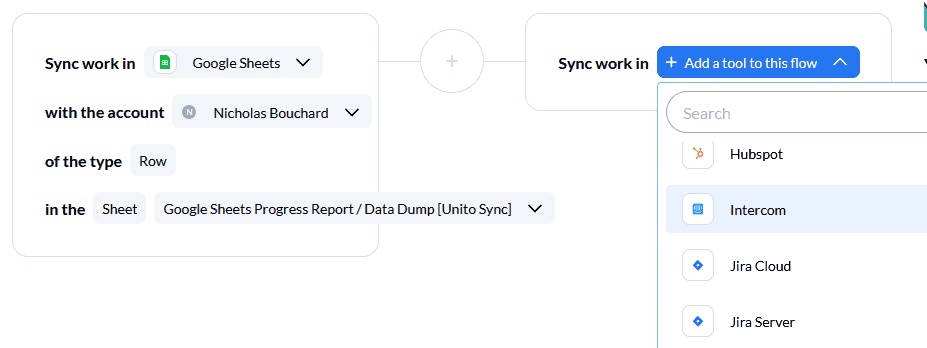
Start by connecting your blocks of work. On one side, you’ll pick the sheet you’re using for this report and choose the Data dump table. On the other side, pick the Jira project you want to report on. You can report on multiple Jira projects by building a flow for each one.
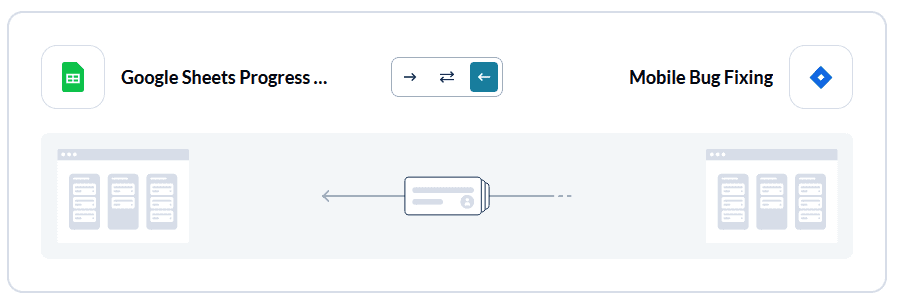
Next, pick your flow’s direction. For a reporting flow, you’ll want to set up a one-way flow, with data flowing from Jira to Google Sheets. If you set up a two-way flow, creating new rows in Google Sheets would create new Jira issues. Since you don’t want that, leave this as a one-way flow. Don’t worry, any changes made in either tool will still update the other.
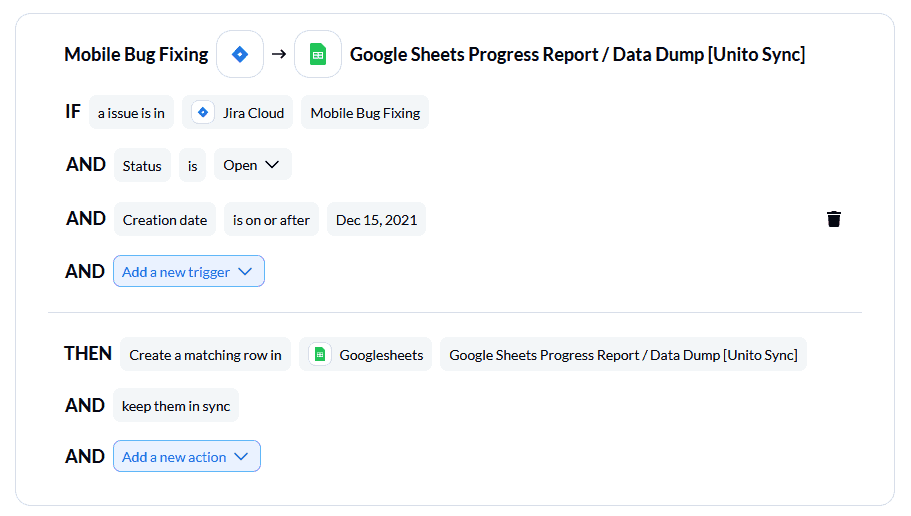
From there, you can set up rules that filter the information coming in from Jira. You don’t need any rules to make this template work. But if you wanted to leave specific Jira issues out of your report, you could build a rule that filters out issues with a certain assignee, label, and more.
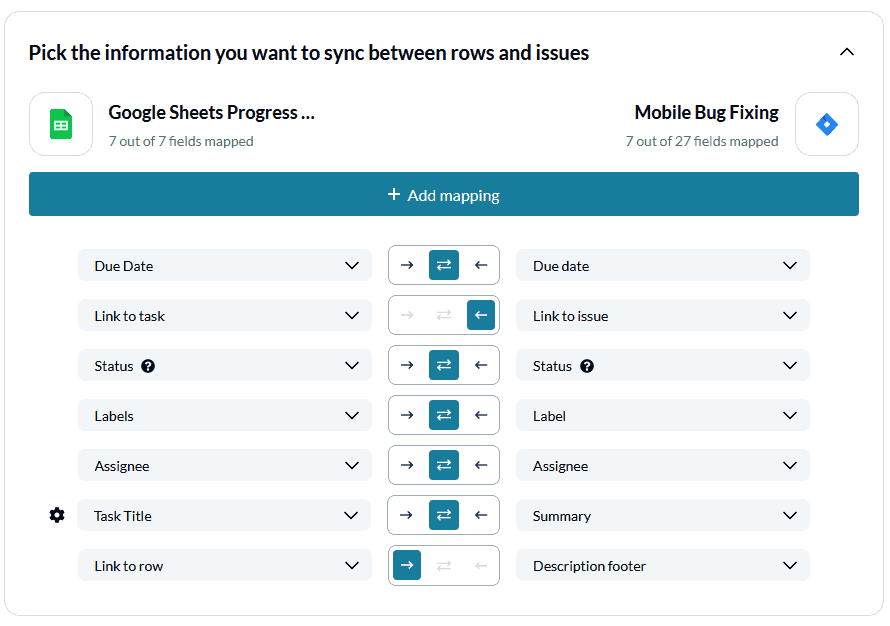
Finally, it’s time to map your fields. Field mappings help Unito translate information from one tool into something that will make sense for the other. Follow the field mappings in the image below so your Jira issues are properly represented in your Google Sheets report.
Once that’s done, you can launch your flow! Unito will automatically populate your Google Sheet with data from Jira. Graphs and charts will tick up to reflect progress in your work tools, and your stakeholders will have a dynamic report they can consult at their convenience.
Sync your project progress to Google Data Studio
Building an automated progress report in Google Sheets is one thing, but what if you’d prefer to sync your data to Google Data Studio, too?
You can use the same Google Sheets template, follow the same process to get your data into the spreadsheet, and then use it as your main data source for this Google Data Studio template.
Build a Unito flow in the same way you did above, and you’ll sync information from your work tools (such as Salesforce) to Google Sheets. Then, copy the Data Studio template and you will be prompted to change your data source (if you disregard the prompt, you can also go to Resources, then Manage added data sources, in order to do so). Use your Google spreadsheet (tab “Task Statistics”) as your data source, and the Data Studio template will be automatically updated with your data.
FAQ: Building a Jira reporting dashboard in Google Sheets
What is the difference between a Jira board and dashboard?
Jira boards are best used to track work at the task level. Jira dashboards give you high-level information, useful for keeping stakeholders informed and optimizing workflows.
A Jira board represents product management and software development work as cards on a board, which move from column to column as you work on them. A board will typically show you work that’s currently in progress, work that’s been finished, and even potential work for future sprints. You can also use a single board to house issues from more than one project, but its reporting abilities are limited.
A Jira dashboard is a page full of multiple custom charts and project reports that give you tons of information on your projects at a glance. Fully customizable, these dashboards allow you to create reports to focus on just about any aspect of your workflows, from burndown rates to workload management.
What is a progress report?
A progress report is one of the best ways to communicate how much work you’ve done and what still needs to happen. Often, that work will be broken down by collaborator, so you can see who’s got a lot on their plate and who’s falling behind. Project managers often use these reports to keep stakeholders informed as a project progresses.
Usually, these reports are created regularly according to a pre-determined schedule. For a short project, progress reports might come out weekly. Longer projects might only need reports once a quarter. It can often take hours to produce these reports, especially when data needs to be collected from multiple sources. In our Report on Reporting, we found that half of respondents had to deal with multiple sources when building reports.
But when you’re using the right tool — and the right template — you can build reports that automatically collect information from your tools and stay up-to-date without any manual work.
Why Google Sheets, Jira, and Unito?
Google Sheets is a spreadsheet tool that’s part of the Google Suite. You can use it to build reports, hold databases, and even manage projects. Here are just a few reasons why Google Sheets is a strong choice for building your progress reports:
- It’s free: Being part of the Google Suite, Sheets is completely free to use.
- It’s everywhere: You’re probably already using it without realizing it.
- It’s powerful: Google Sheets has powerful features that make it a great fit for reporting. Plus, it’s built with collaboration in mind.
Jira is one of the most popular work management and issue tracking platforms for software teams. It supports Agile methodology and it’s built with software development in mind. Your software team is probably using it to track their work, and that makes it a natural fit for this workflow.
Unito is a no-code integration solution with some of the deepest two-way integrations on the market. In just a few clicks, you can build flows that sync important data across work tools in real time. That means you can turn a spreadsheet into a dynamic report that’s kept up-to-date as work happens in other tools.