10 of the Best Automated Reporting Tools
While in an ideal world there’d be endless time and resources available to take precious time to create every single report a business needs, that’s just not realistic. From collecting data to reducing human error, reporting automation tools — software that automates the process of gathering data from various sources and transforming it into reports — offer a comprehensive and time-saving solution.
In this blog post, you’ll find some of the best automated reporting tools and their pricing. You’ll also learn how they help organizations of any size improve and streamline their reporting processes.
What is an automated reporting tool?
Reporting is all about sharing crucial data and important takeaways, but it often involves a ton of manual work. Automated reporting tools help to mitigate this, often by automating the transfer of data between multiple data sources, automatically creating visual dashboards, or even flagging problematic data. These tools will often be called different things, like integration platforms, business intelligence tools, or dashboarding programs.
No matter what they’re called, all these tools are about automating your reporting workflows to make your life easier.
Unito: Reporting Automation for all Platforms

Unito isn’t a dashboarding platform or a business intelligence tool; it’s the glue that turns disparate data sources into a unified reporting workflow. With 30+ integrations for some of the market’s most popular tools, from project management tools like Asana and Trello to powerful spreadsheet software like Google Sheets and Excel, it’s the best way to get data where it needs to go — no matter how many tools it has to go through.
As a workflow management platform, Unito is a lot simpler to set up and use than many business intelligence tools or dashboarding platforms. The screenshot above shows a reporting template in Google Sheets fed with data from Trello and Asana using Unito. This means that, with a Unito integration, anyone can build a dashboard.
Pricing
Unito’s pricing starts at $65/month for the Starter plan, scaling up to the Business plan starting at $1439/month. Custom enterprise plans are also available.
TapClicks: Report automation tool for enterprise
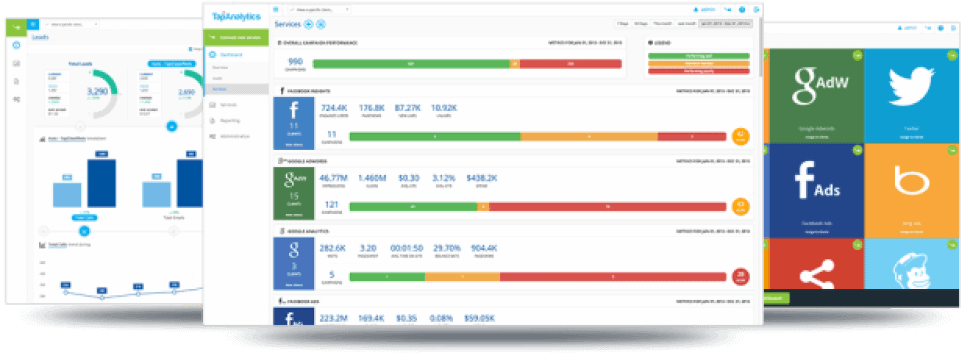
TapClicks is an enterprise-level dashboard program for agencies and brands that need to automate the reporting of large and complex data sets for their clients.
With the ability to connect to almost any marketing platform, TapClicks can collect data from more than 6000 sources including TikTok Ads, Verizon, Facebook Ads, Google Ad Manager and Analytics, and HubSpot Analytics. It then takes this data, compiles it in a centralized dashboard, and automates the reporting process.
After you set your first dashboard and report with the custom calculations you and your client require, you’re able to save this as a template, apply it to future campaigns and clients, and have it automatically update at a frequency of your choice. TapClicks can then automatically visualize your metrics in the form of reports, charts, graphs, and other visuals. Plus, TapClicks Report Studio feature can pull the data and visuals into client-ready presentations that can be sent to your clients based on a cadence of your choice (ie. weekly, monthly, etc.), and will automatically refresh to include the most up-to-date data. This helps keep stakeholders informed and happy, without the need for constant manual updates from your team.
Pricing
TapClicks offers a free 14-day trial. As it’s an enterprise-level tool, their pricing is custom to each business’ needs and requires speaking to one of their representatives. That said, they have a tool you can use to get an estimate of your plan before reaching out to their sales team.
Tableau: Automated reporting tool with the best integrations
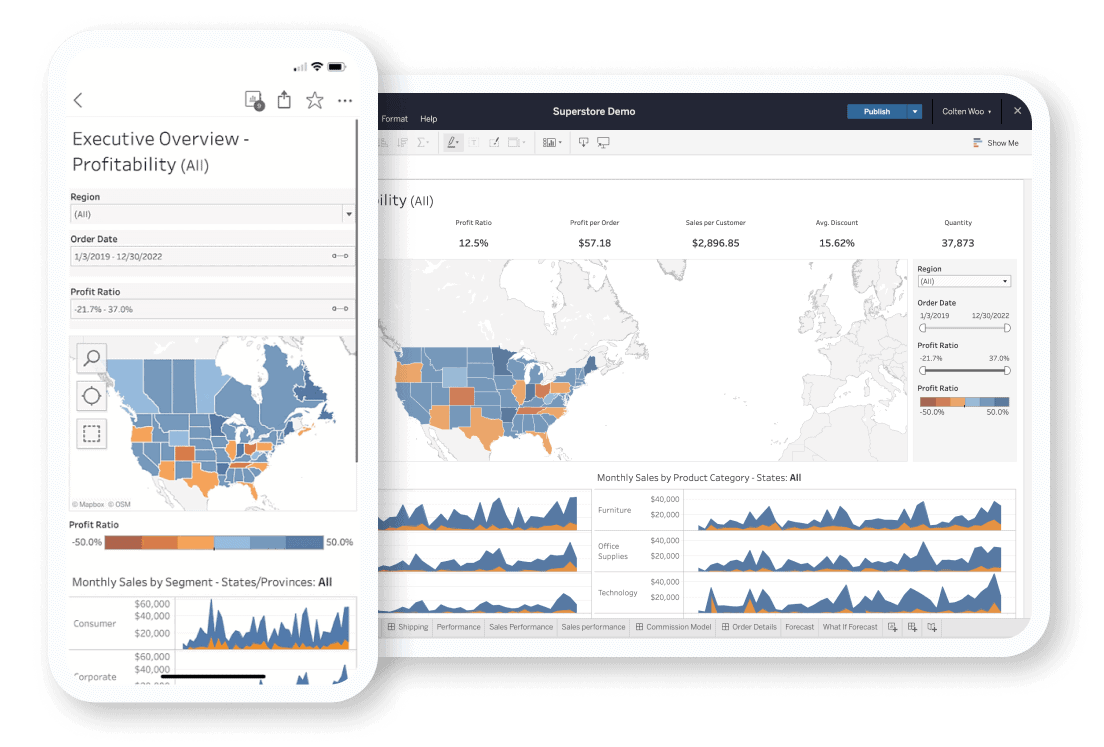
As the self-professed “world’s leading analytics program,” Tableau is a business intelligence platform trusted by organizations such as Whole Foods, Verizon, and the Royal Bank of Canada.
With the ability to integrate with hundreds of data sources — both native such as PDFs and spreadsheets as well as applications and cloud-based platforms — Tableau lets you collect data no matter where it’s stored. Once you’ve set up your data dashboard, you’re able to schedule automatic updates and reports that can be sent to clients, your teammates, and senior leaders at regular intervals, and with customized security permissions.
As Andrew Jones, Staff Engineer at ARM shares, “Tableau has enabled us to build and deliver reporting across all projects, automated every week, without an engineer spending that precious time doing it themselves each time.”
Pricing
After a free trial, Tableau’s plans start at $75 USD per month, per user.
Funnel: Best for data analysis
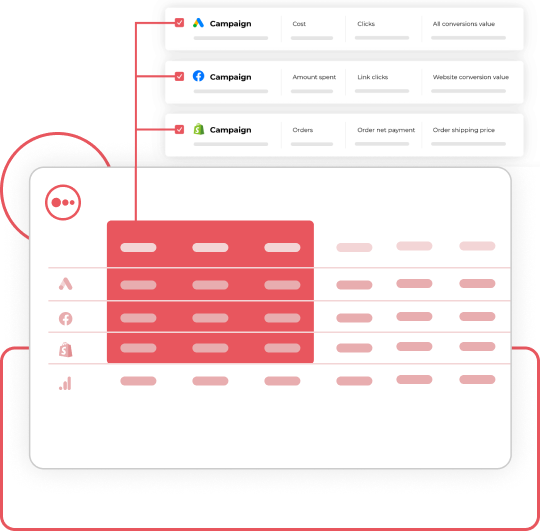
Used by organizations like Ogilvy, Sony, Superdry, and Klarna, Funnel is an analytics and reporting automation tool that aims to take the manual effort out of the data transformation process.
Funnel lets you source data from more than 500 marketing platforms such as Salesforce, Shopify, and Instagram. From there, it automatically labels, cleanses, organizes, and sends updates and reports on your data, whenever needed. With automatically updated reports and securely managed data visibility, Funnel lets you share data and insights with your team and stakeholders in minutes.
Plus, due to Funnel’s promised 99.9% uptime, you’re able to rely on their automated reporting to never leave you — or your clients and stakeholders — in the dark. This came in handy for Arm Candy, one of Funnel’s clients. Their previous tool kept failing, so they turned to Funnel for their report automation needs. Since then, they estimate that their team saves more than 12 hours per week thanks to Funnel’s reporting automation tools.
Pricing
After a free trial, Funnel offers three plans, with their pricing based on the number of credits (called flexpoints) you use:
- The Starter plan, at $1.20 per credit, covers 121 connectors and three destinations.
- The Business plan, at $1.50 per credit, covers everything in Starter plus 381 connectors and 37 destinations for your data.
- The Enterprise plan, at $2.00 per credit, covers everything in Business plus 11 connectors and one destination.
Zoho Analytics: Best reporting software for Zoho users
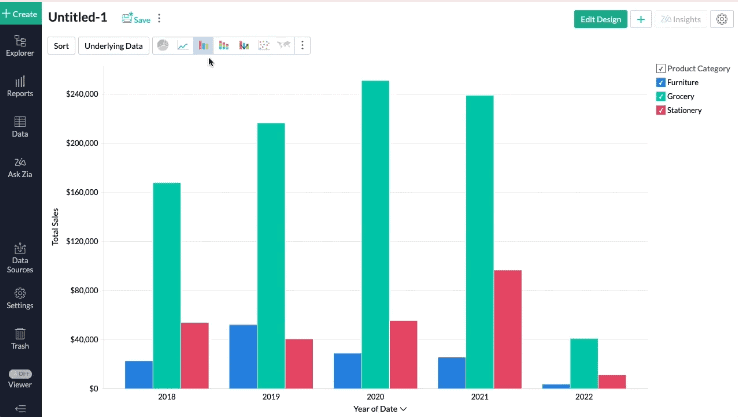
Using AI, Machine Learning, and NLP (natural learning processing) technologies, Zoho Analytics provides data visualization, reporting automation, and analysis tools.
With Zoho Analytics’ auto analysis capability, users can cut down on time spent manually creating reports by automatically generating reports and dashboards from data pulled from more than 100 popular business applications. Plus, automatically send these reports to team members, management teams, and non-Zoho users at a daily, weekly, monthly, or yearly cadence.
Once you’ve created your report in Zoho Analytics, you can use the drag-and-drop interface to customize it by visualizing the data in the form of tables, charts, and graphs or adding calculated fields, applying filters, and creating drill-down reports to highlight further insights and trends in the data. Besides these features, Zoho Analytics also includes a smart AI assistant that can generate automated insights, help forecast trends, and more.
Pricing
Zoho Analytics starts at $30 CAD per month for two users.
Swydo: Reporting automation tool for marketers
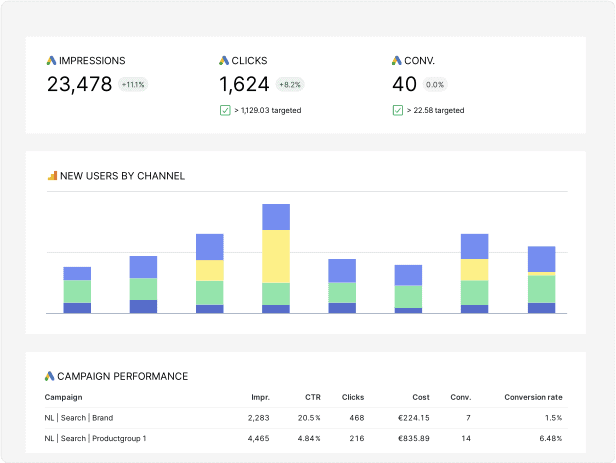
Swydo is a reporting automation tool created for both in-house marketing teams and agencies.
With Swydo, users can streamline the collection of real-time data from sources such as Klaviyo, Google Analytics, Semrush, and more. Once the data sourcing is set up, there are hundreds of available templates and predefined widgets you can choose from to organize and present your data using their drag-and-drop interface. Swydo’s templates automatically update with the latest data from your integrated sources, saving you and your team the time it would take to manually do so. Plus, if you need a widget that Swydo doesn’t currently offer, you have the ability to create a totally custom one and incorporate it into your reporting.
With automated reporting, Swydo lets you set up the parameters of a report once, and then schedule that report to automatically send as often as you need, to whoever needs it. These regular reports can help highlight the improvements seen across your data and show areas that need more attention, in a format that’s easy to understand for both your team members and clients alike.
Pricing
Swydo offers a free 14-day trial. After that, their paid plans start at $39 per month.
AgencyAnalytics: Reporting automation tool for agencies
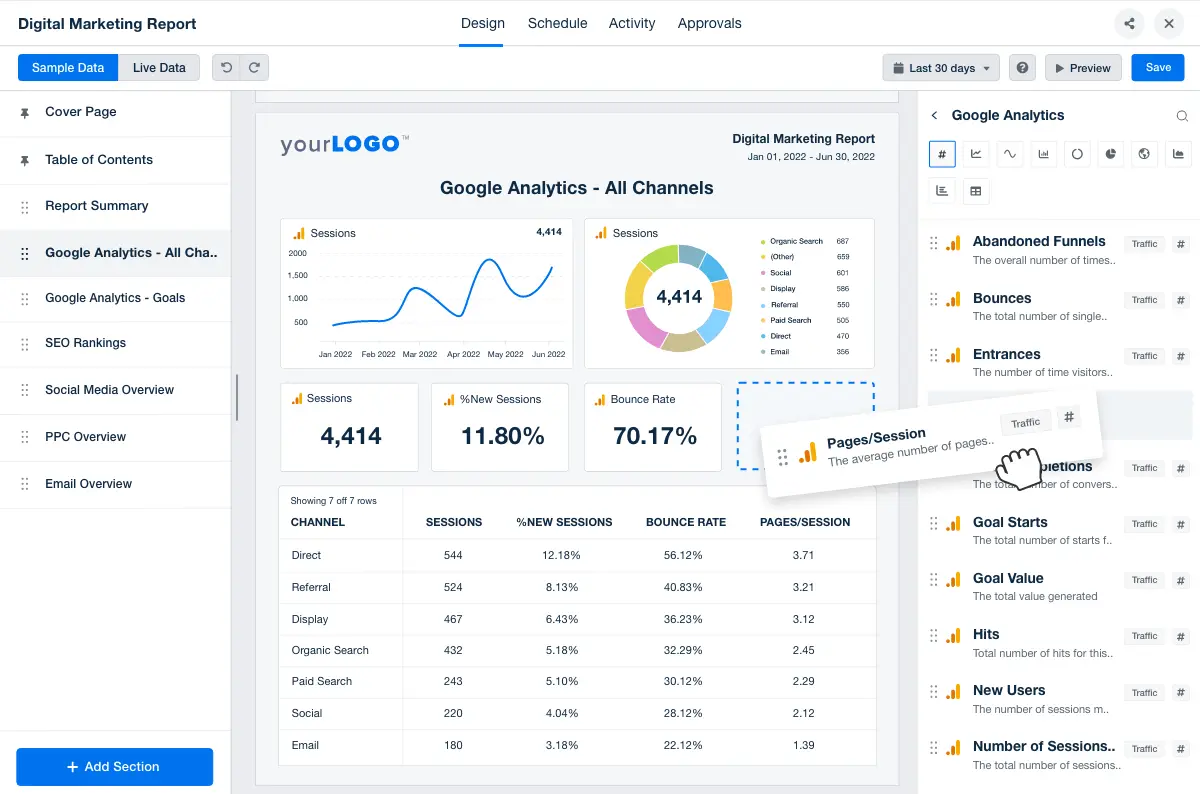
As the name implies, AgencyAnalytics is a reporting automation tool designed with agencies in mind. Because of this, the more than 60 integrations it supports are ones you and your clients would normally work with.
AgencyAnalytics features customizable dashboards that automatically source and pull your clients’ data and metrics in one place. When creating a custom dashboard, you’re treated to an intuitive drag-and-drop interface that doesn’t require extensive technical skills to use. Plus, you can create separate dashboards not only for each client but for each client’s specific goals, objectives, and activities. For example, you could have one dashboard for a client’s social media analytics, and a separate one for their SEO metrics. These separate dashboards can also feature unique color schemes and customizations to make things even easier for you and your clients.
AgencyAnalytics’ easy-to-understand visual dashboards can present the data in the form of pie charts, bar charts, graphs, and more — plus have them automatically transformed into reports. You can then schedule the reports to send at a time selected by you, and have them accompanied by a customizable email. In addition to receiving automated reports, you can save even more time and energy by providing your clients with unique login access that let them check in on their data at any time, from anywhere (without them constantly asking you for manual updates).
Pricing
AgencyAnalytics offers a free 14-day trial. After that, their paid plans start at $12 per month.
NetSuite: Automated reporting software for enterprise
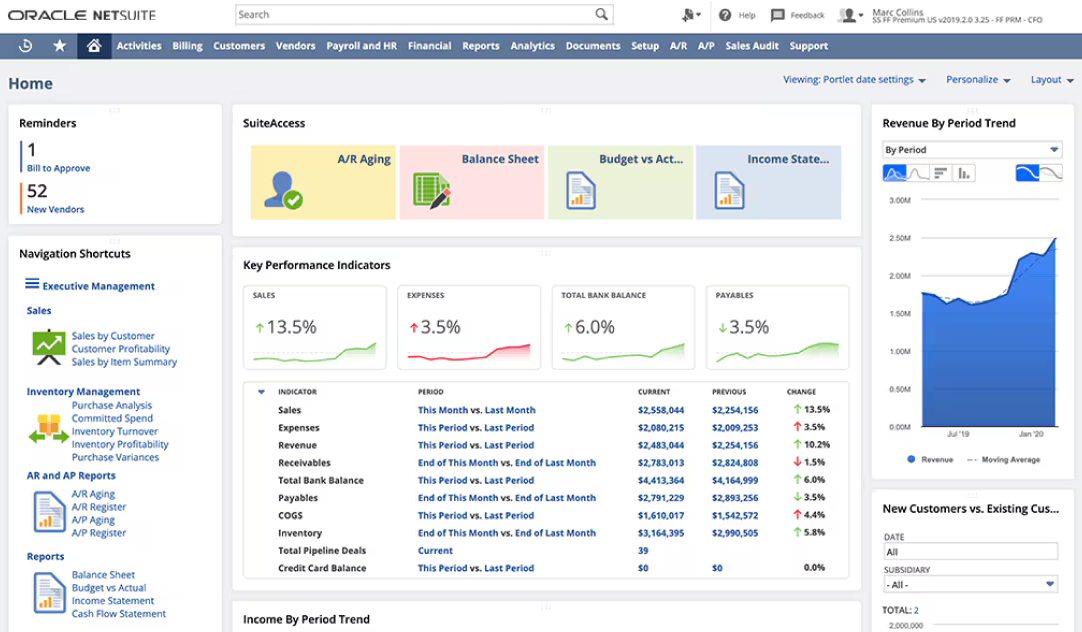
NetSuite is one of the most popular ERPs (Enterprise Resource Platform) on the market. Whether you need commerce features, business intelligence, or a CRM, NetSuite is a complete all-in-one solution. Because it can be used for just about any task, all your data stays in one place, meaning NetSuite’s automated reports cover everything. No need for integrations or manual data transfers.
NetSuite’s AI-powered reporting features allow business leaders to dive into important data across all business functions. It’s your one-stop shop for getting things done and going into the data involved.
Pricing
With most enterprise solutions, you have to reach out to their sales team to get a quote. That’s the case with NetSuite, too.
Looker Studio
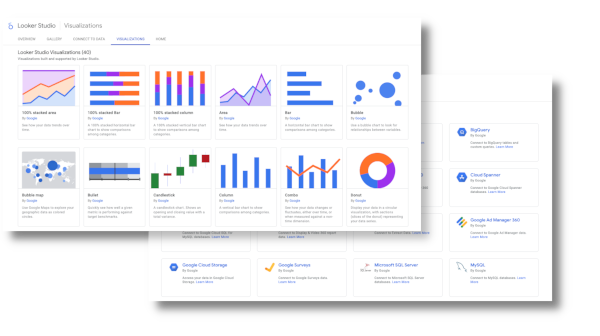
A self-serve tool that can make business intelligence and automated reports accessible to anyone with a Google Workspace, Looker Studio can connect with over 800 data sources and display all kinds of dashboards. You don’t need a technical background to use this platform. Just connect your tools, use one of the many available report templates, and start analyzing your data.
That’s not all you can do, however. The Looker Studio API means you can easily load data into other platforms, including other data reporting tools.
Pricing
You’ll need to get in touch with a sales team at Google to get a price for Looker Studio.
Supermetrics
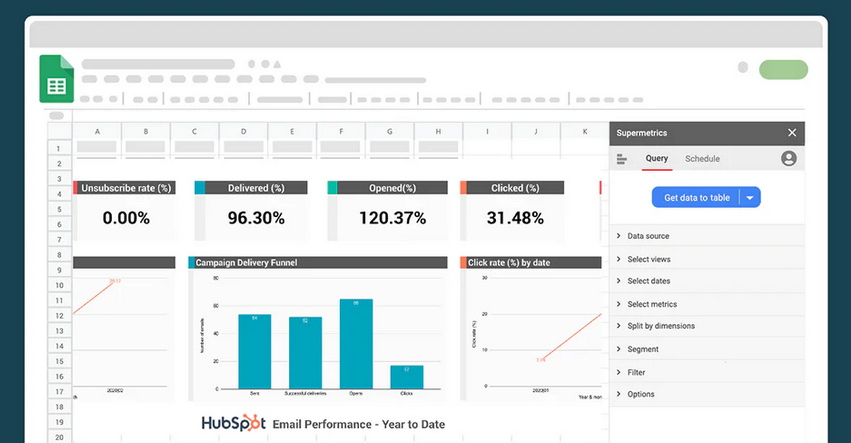
An automated reporting tool specifically for marketers, Supermetrics is an integration platform that pulls data from all the sources marketers care about the most and loads it into spreadsheets, business intelligence tools, data integration platforms, and even monday.com.
Spreadsheets are ubiquitous, and still one of the most common ways to build reports and source data. A tool like Supermetrics, which turns spreadsheets into automated reporting powerhouses, can be a solid option for organizations that aren’t ready to spring for a dedicated tool.
Pricing
With Supermetrics, you pay for each data destination used as part of your workflows. Destinations like Looker Studio and Google Sheets, for example, start at $29 a month each. Others, like Snowflake and BigQuery, have custom pricing — so you’ll need to get a quote from the Supermetrics sales team.
Report in!
Although businesses have always relied upon data to inform their strategies, reporting automation tools have become even more critical in the wake of increasing economic uncertainty and instability. With less wiggle room for error, companies are turning to their data with more frequency to offer as much precision as possible while they navigate a rapidly changing economy — and the time-saving tools above are here to help.


