How To Use Airtable Automations To Get More Out of Your Bases (2 Methods)
Sick of entering data into Airtable manually? Here are two methods for streamlining this process with Airtable automations.

How to Sync monday.com Tasks to Microsoft Excel with Automated Updates
Here’s how to build a report in Microsoft Excel based on monday.com by syncing tasks to your spreadsheet with Unito’s two-way sync.

What Is a Monthly Reporting Template? (And Some Templates To Help You)
Monthly reporting templates are used by CEOs, team leads, and project managers to share progress with the rest of the business. Here’s how you can use them, too.

Project Monitoring: What It Is and Why It’s Important
It’s one thing to launch a project, but if you actually want to deliver you need to learn about project monitoring. Here’s how it works and why it’s important.

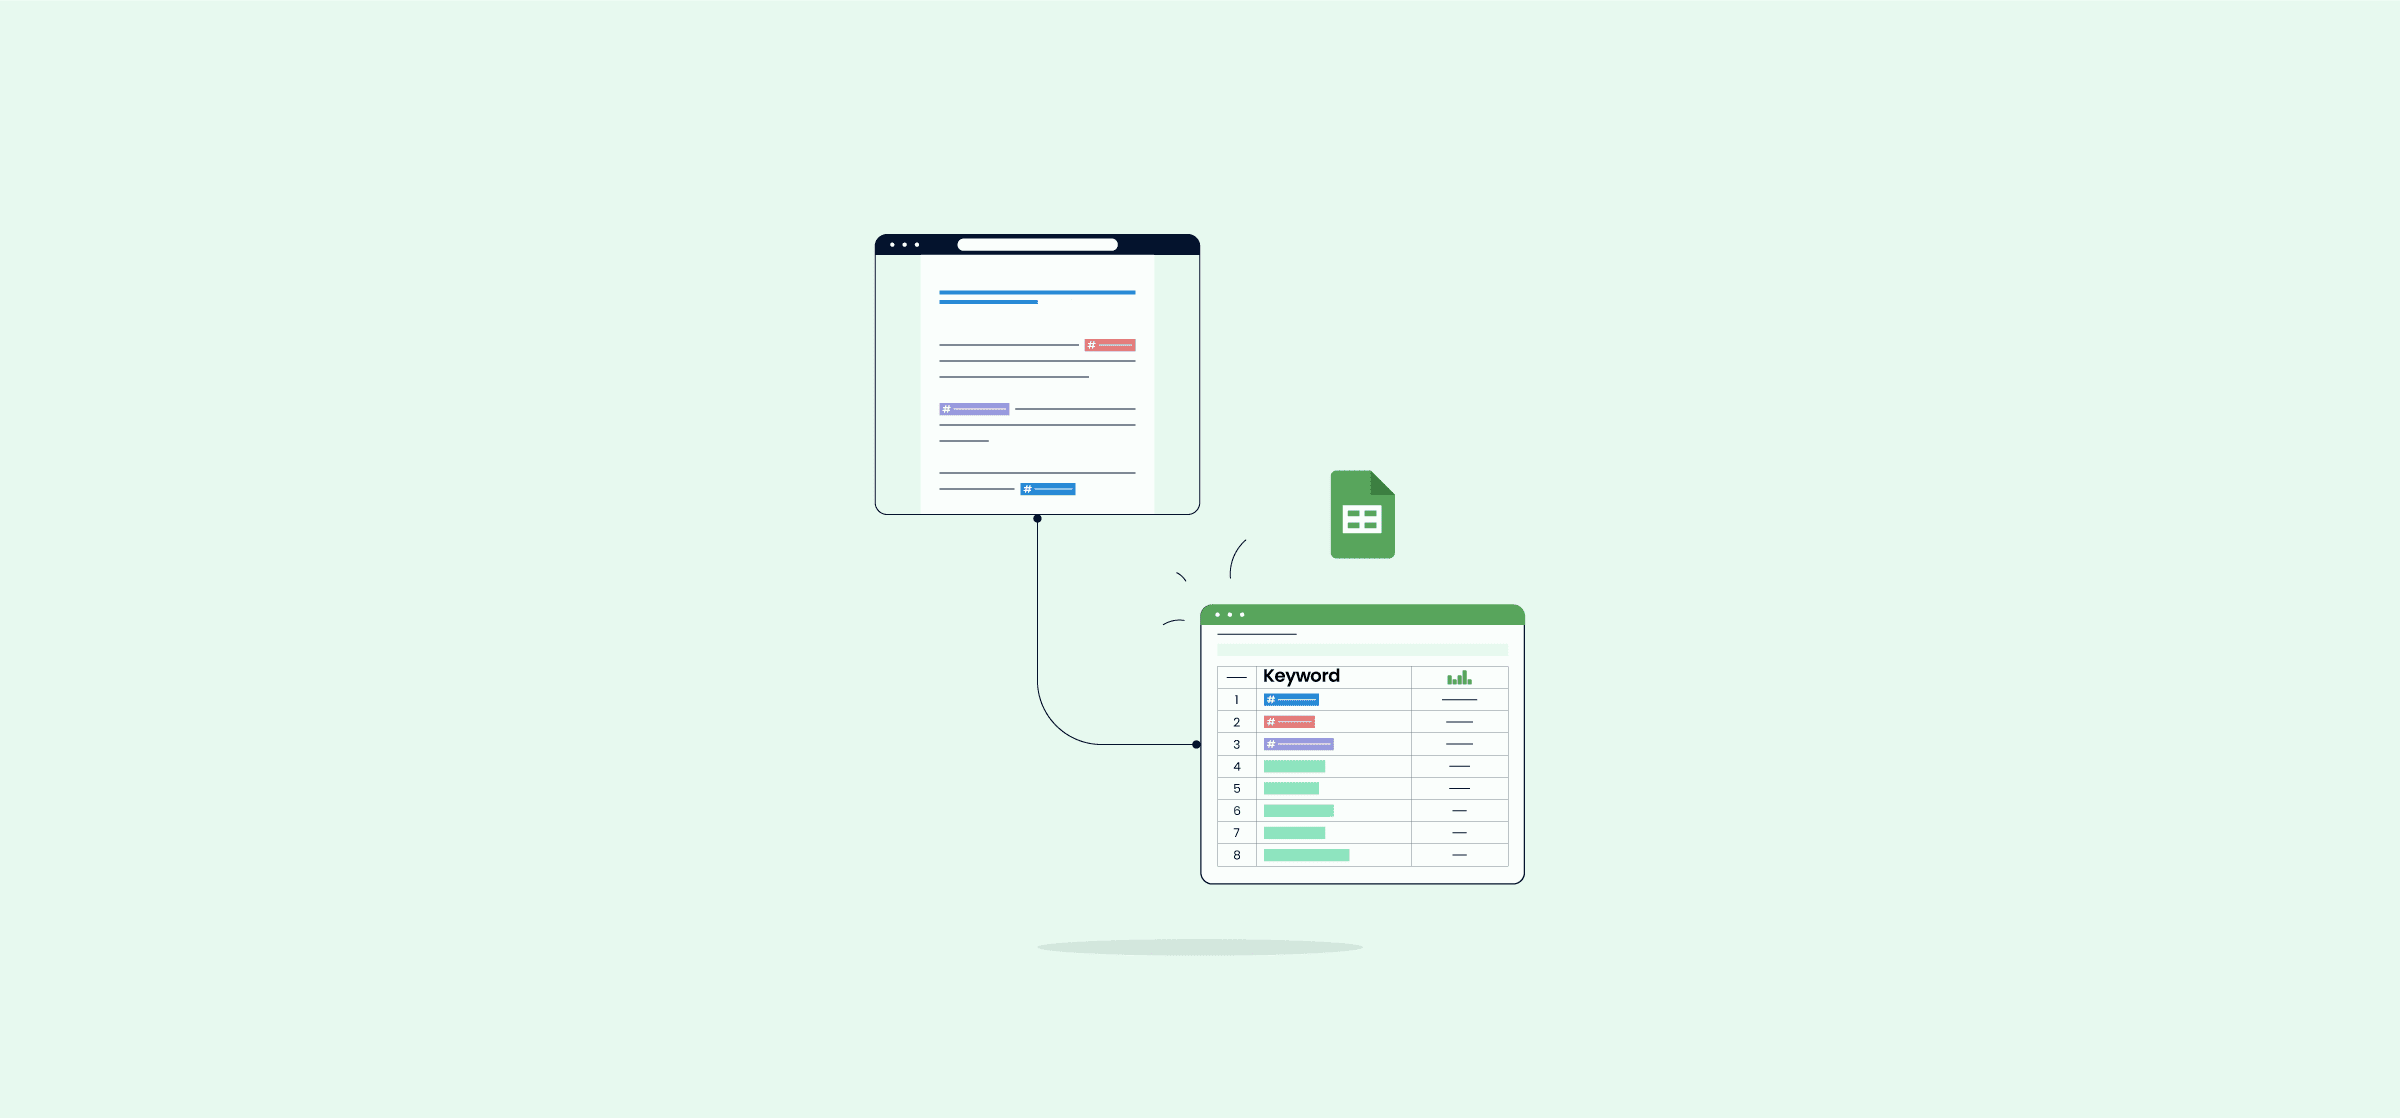
8 Google Sheets Tips for Turning Exported Data Into a Great Report
There are a ton of ways to export data from a tool like Trello or Asana into Google Sheets. But here’s how you can easily turn a data export into a powerful report.

Why Automated Reporting Templates Are Essential To Your Workflows
Reporting is essential, but it can take hours to get right. Unless you use an automated reporting template. Here’s why.

How to Combine Data From Multiple Excel Sheets (2 Methods)
You can combine data from multiple excel sheets through Excel’s built-in consolidate feature or with a platform like Unito.

How to Boost Asana Reporting with Looker Studio, Google Sheets, and Unito
If Asana reports aren’t quite doing it for you, here’s how you can get more out of them by pushing data to Looker through Unito and Sheets.

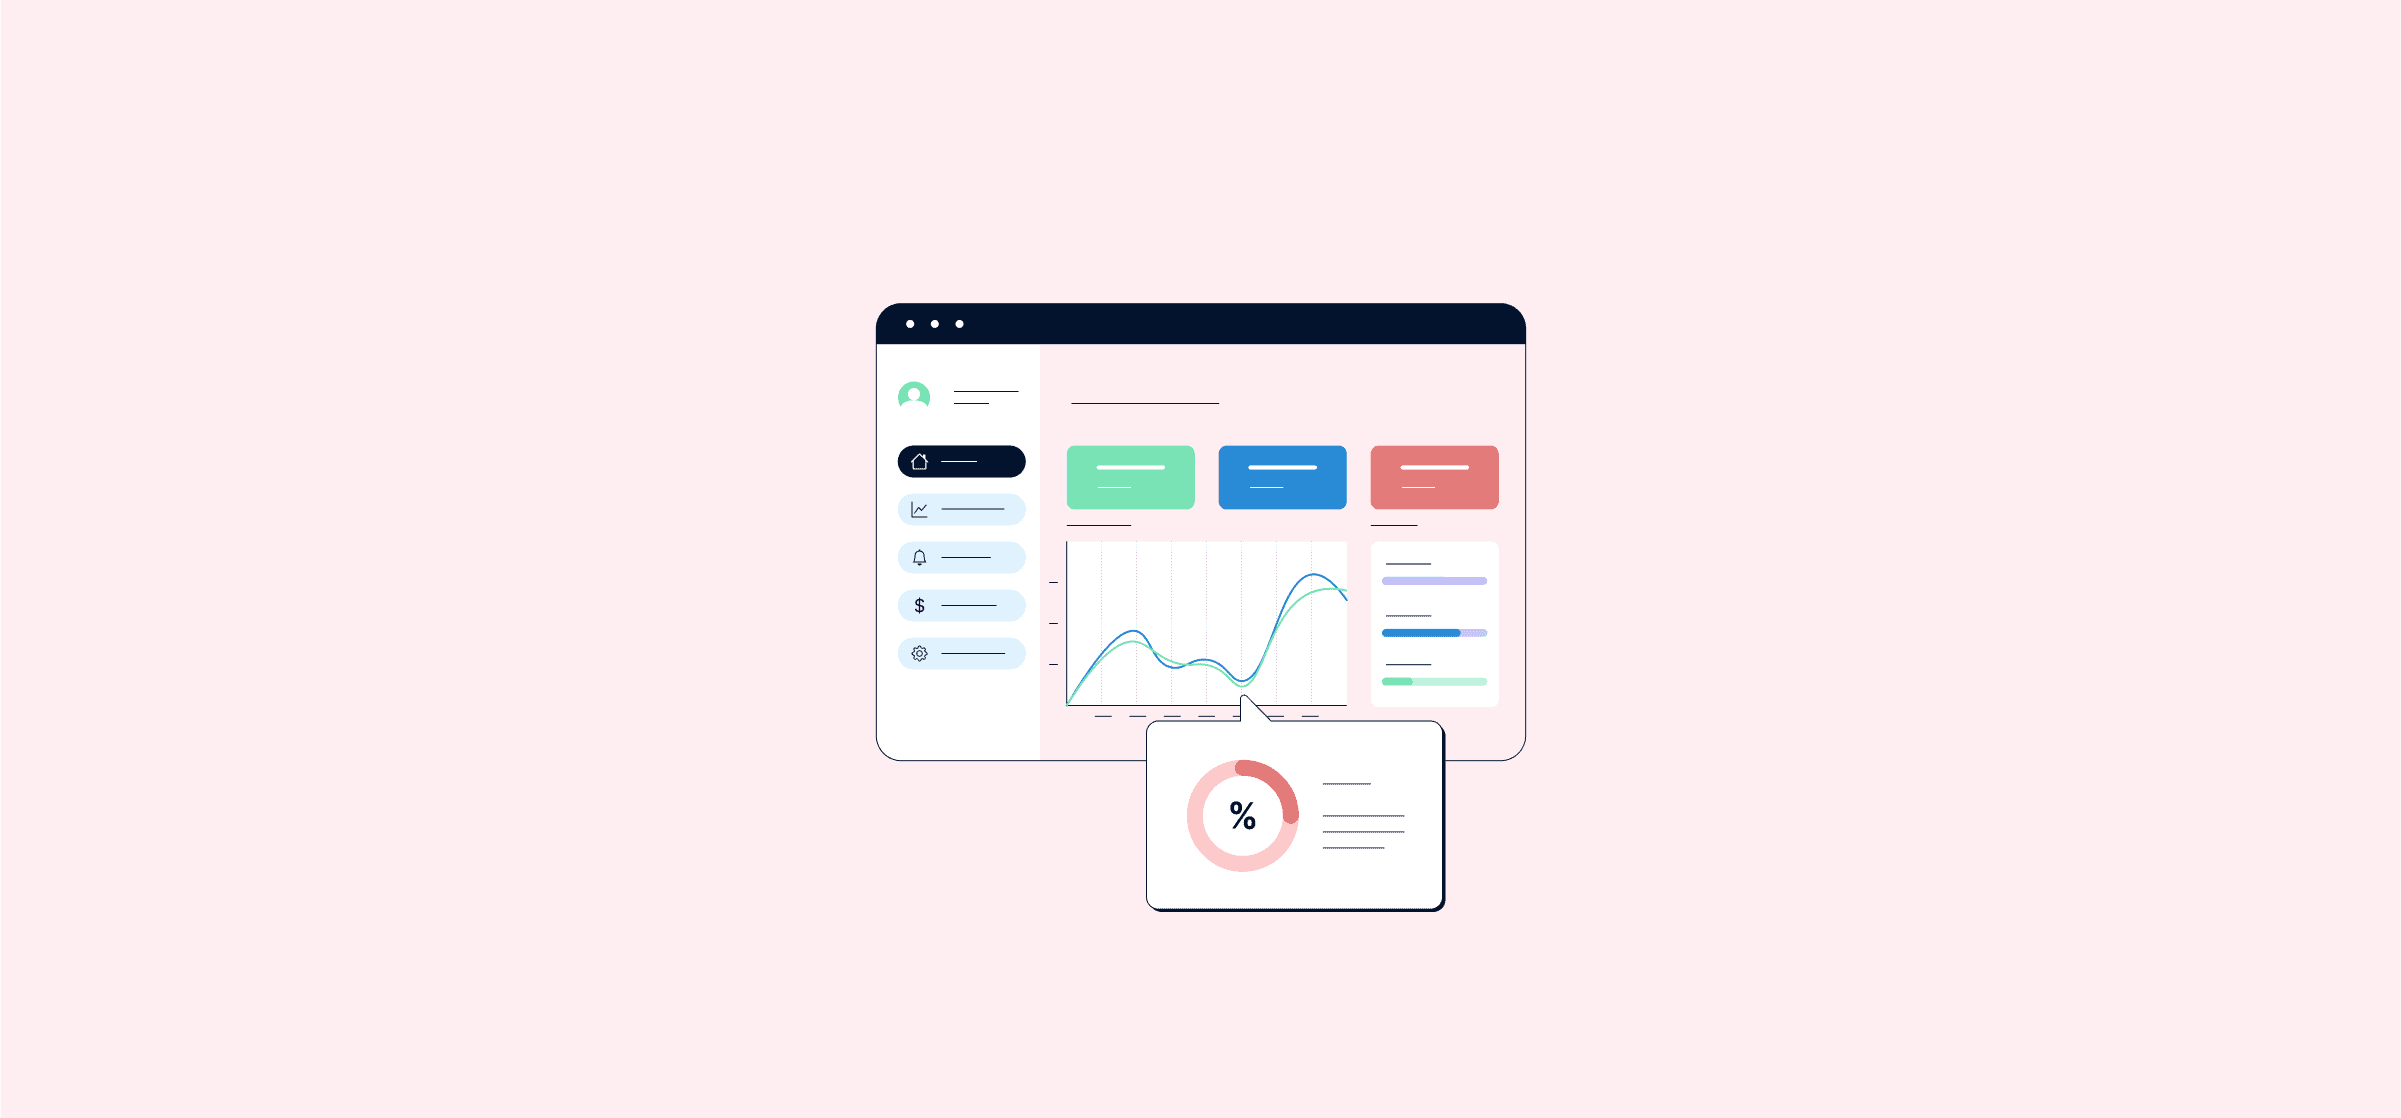
What Is Dashboard Reporting?
With dashboard reporting, your teams can get real-time data on just about any part of their work. Here’s how.

The Ultimate Guide to Automated Reporting
With automated reporting, you can build reports faster and more accurately than you could manually. Here’s how that works.

Data Aggregation 101: What It Is and What It Can Do for Your Team
Data aggregation is about bringing data from multiple sources into a single place and making it more accessible for your team. Here’s how.
