How to Create a Jira Dashboard (2 Methods)
It can be tough to know what’s going on when you just open a Jira project full of issues. That’s why a lot of the work product managers, team leads, and other Jira users do centers around making the hard work of their software development team more visible to other stakeholders. One of the ways they do this? Jira dashboards.
What is a Jira dashboard?
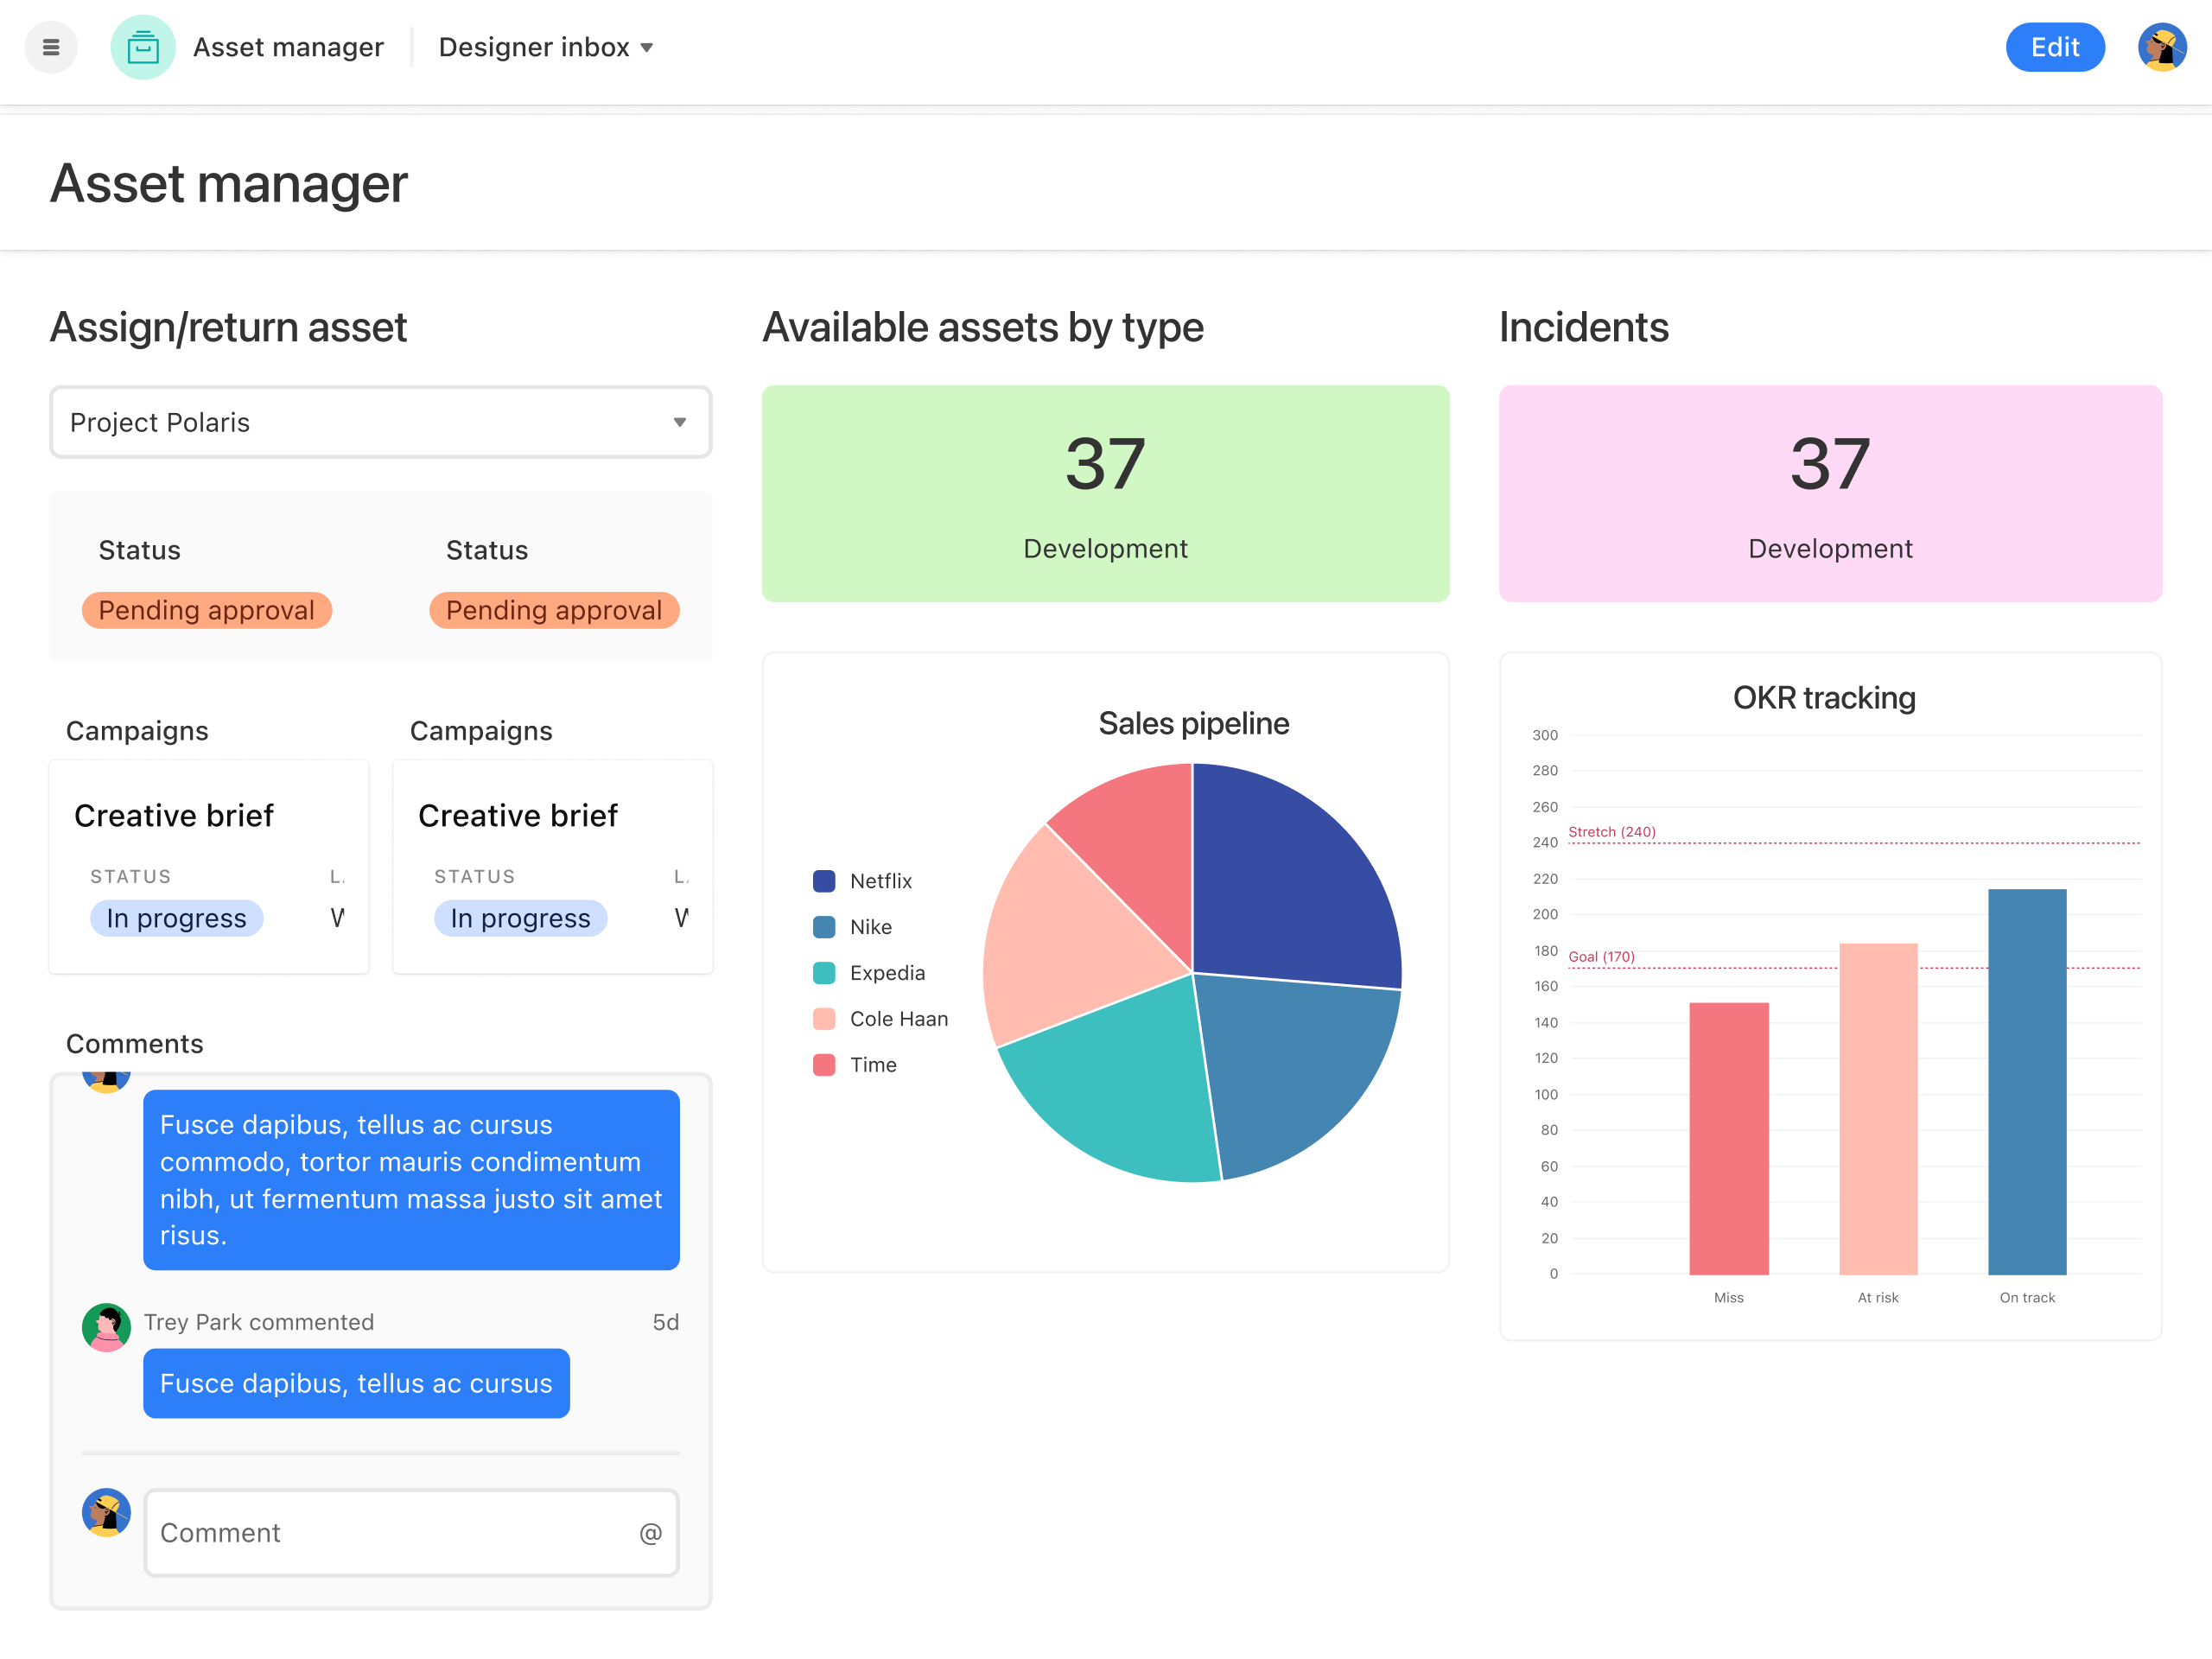
A Jira dashboard is essentially a collection of data points in one place, represented as different charts, graphs, and lists. You can completely customize this live dashboard with the charts and data that you need, getting information on as many different projects as you need in one place.
There are two main ways you can create a Jira dashboard; one relies on built-in Jira features and the other needs a little help from Unito to sync Jira data to another tool.
First method: Use Jira’s built-in dashboards
Creating a built-in Jira dashboard is pretty simple; there’s a Dashboards tab specifically for doing that!
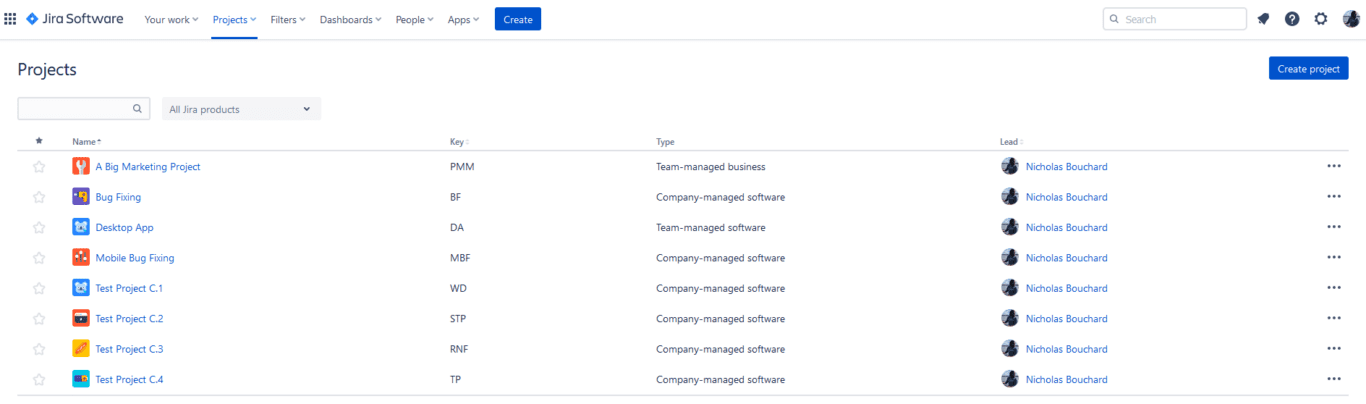
Click on the Dashboards tab and you’ll see this menu.
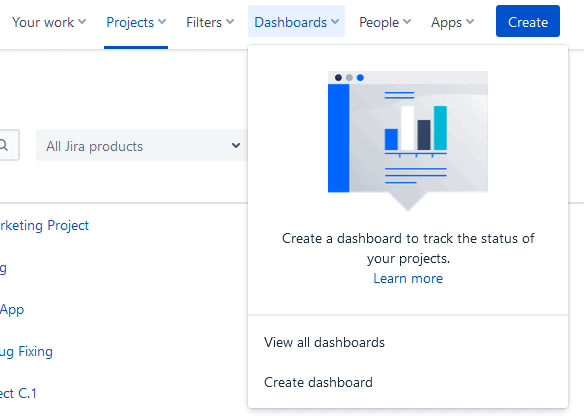
Just hit Create dashboard. Then give your dashboard a name and a description before hitting Save.
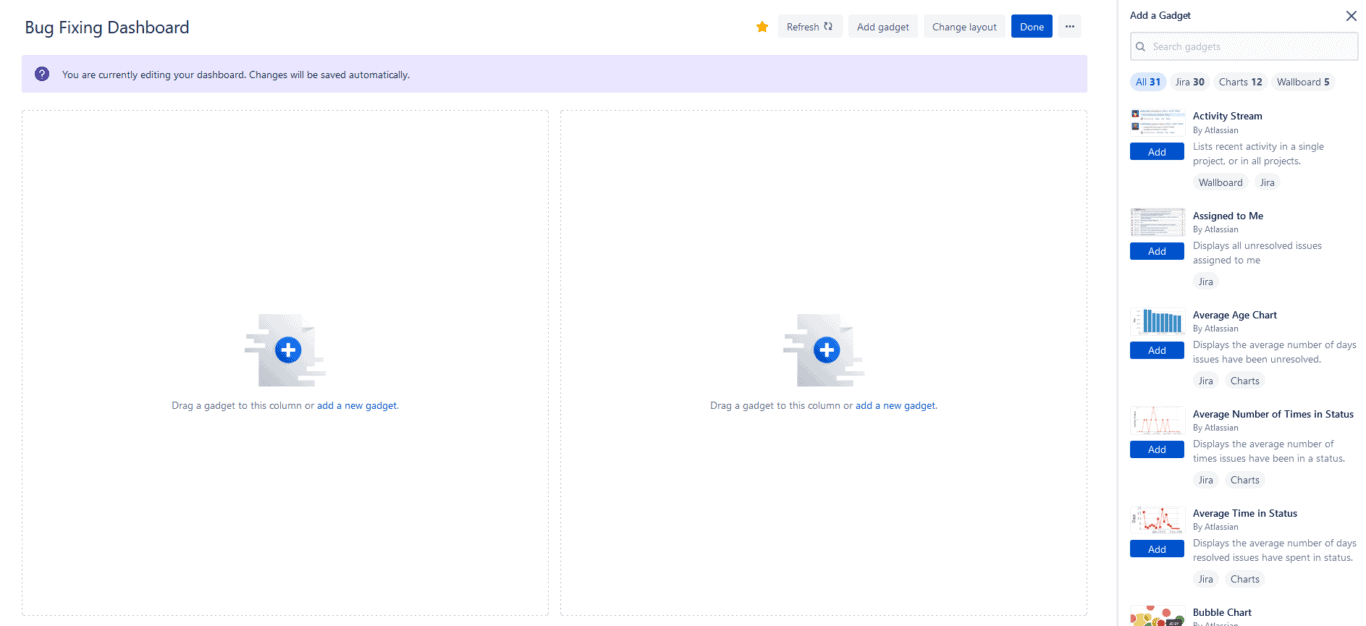
Congratulations, you’ve just created your first Jira dashboard! But you’re not done quite yet. Now you have to choose the gadgets you want to add to your dashboard.
Jira dashboard gadgets represent charts, visualizations, and other aspects of your dashboard. By adding them to your dashboard, you can customize the kind of data you want to pull out of your projects to share with your team and other stakeholders.
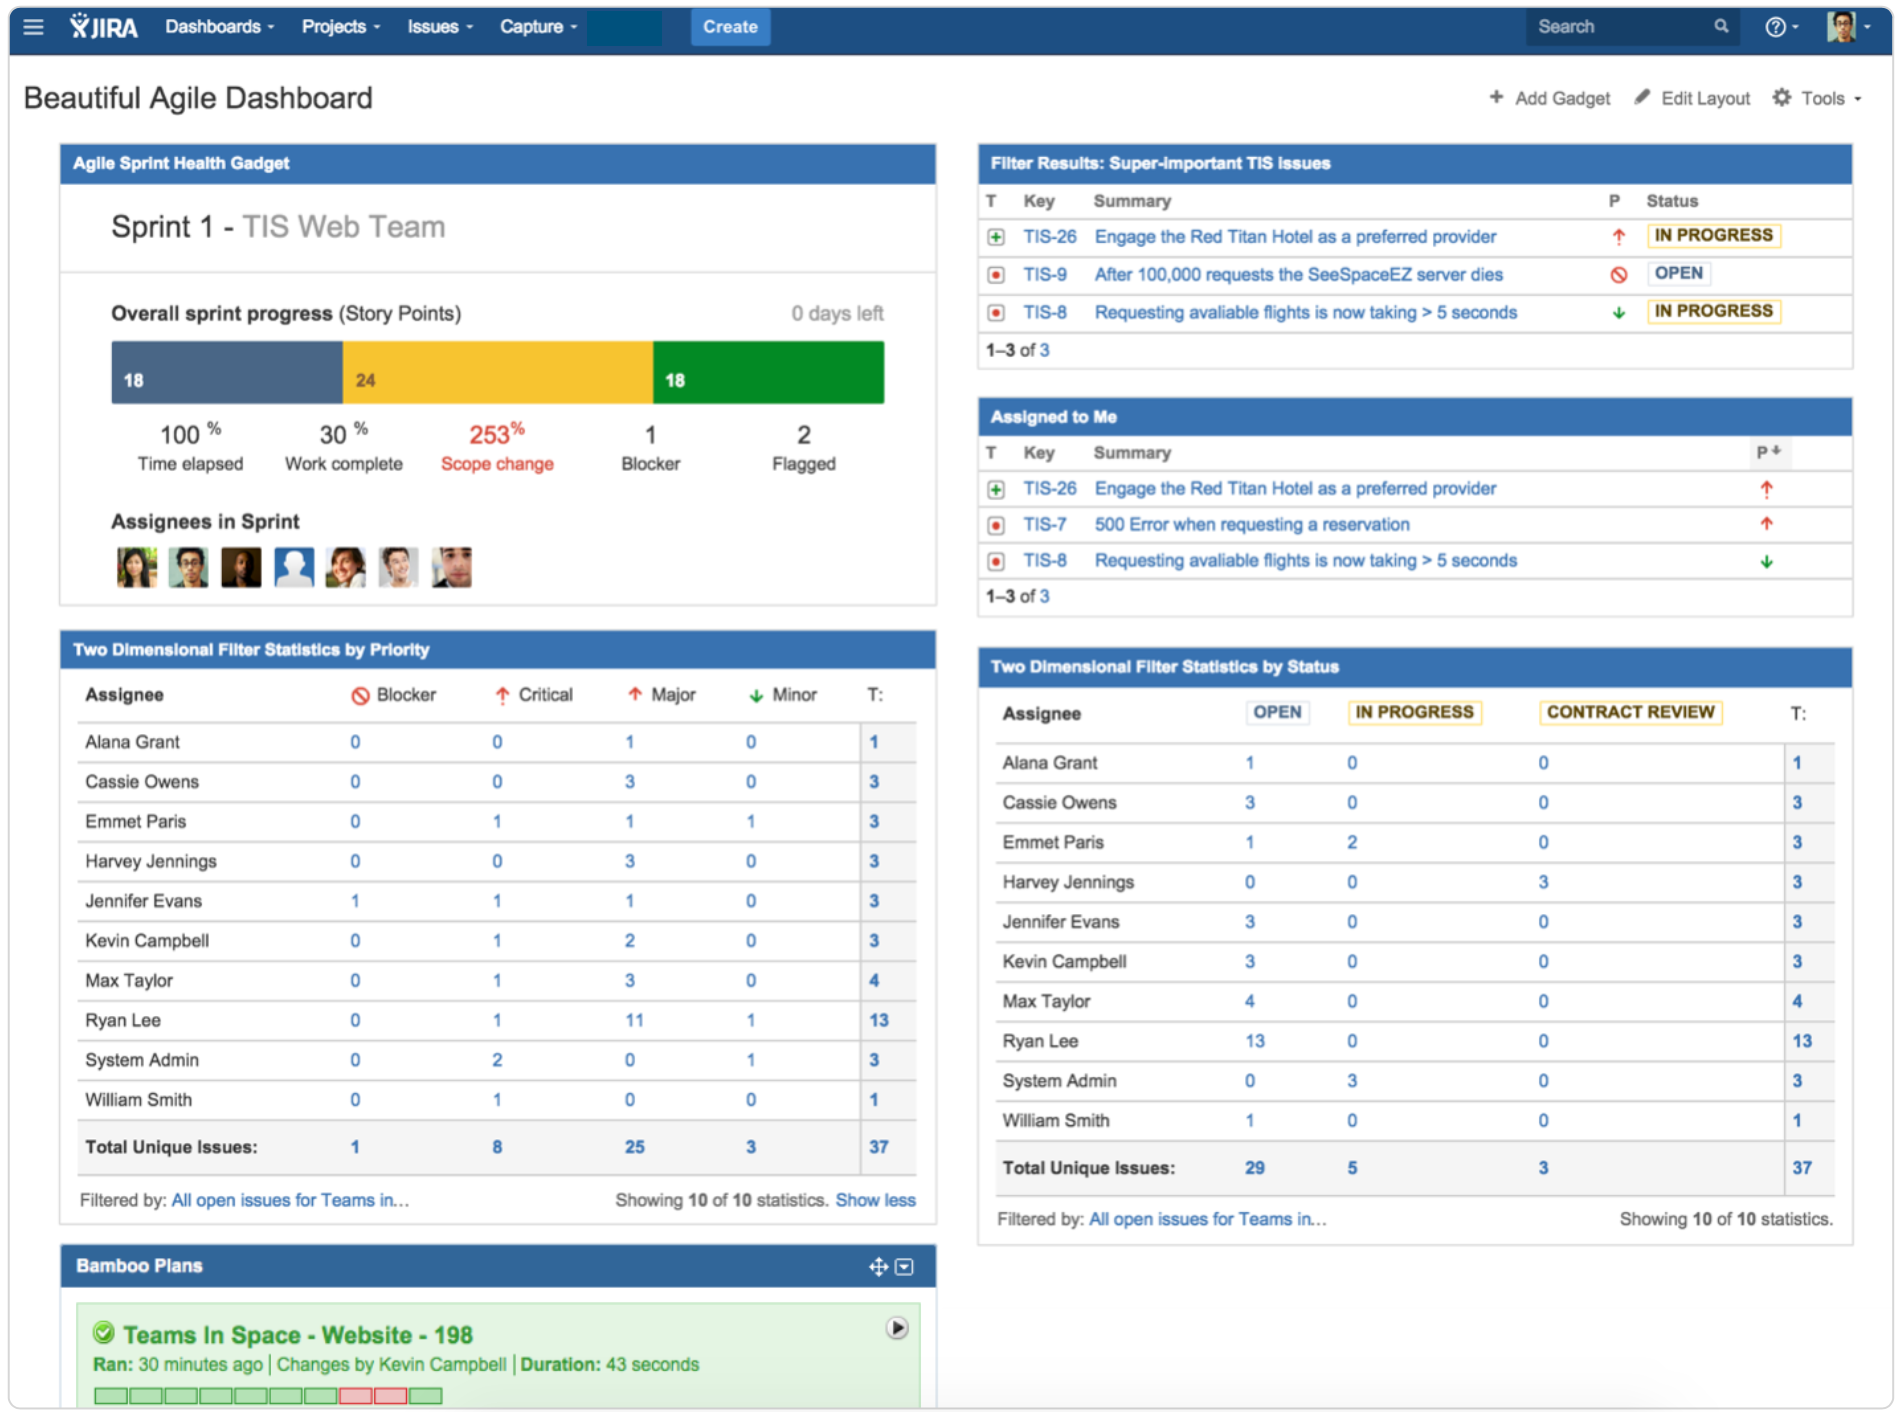
This dashboard, for instance, has the Average Age Chart, Pie Chart, and Issues in progress gadgets.
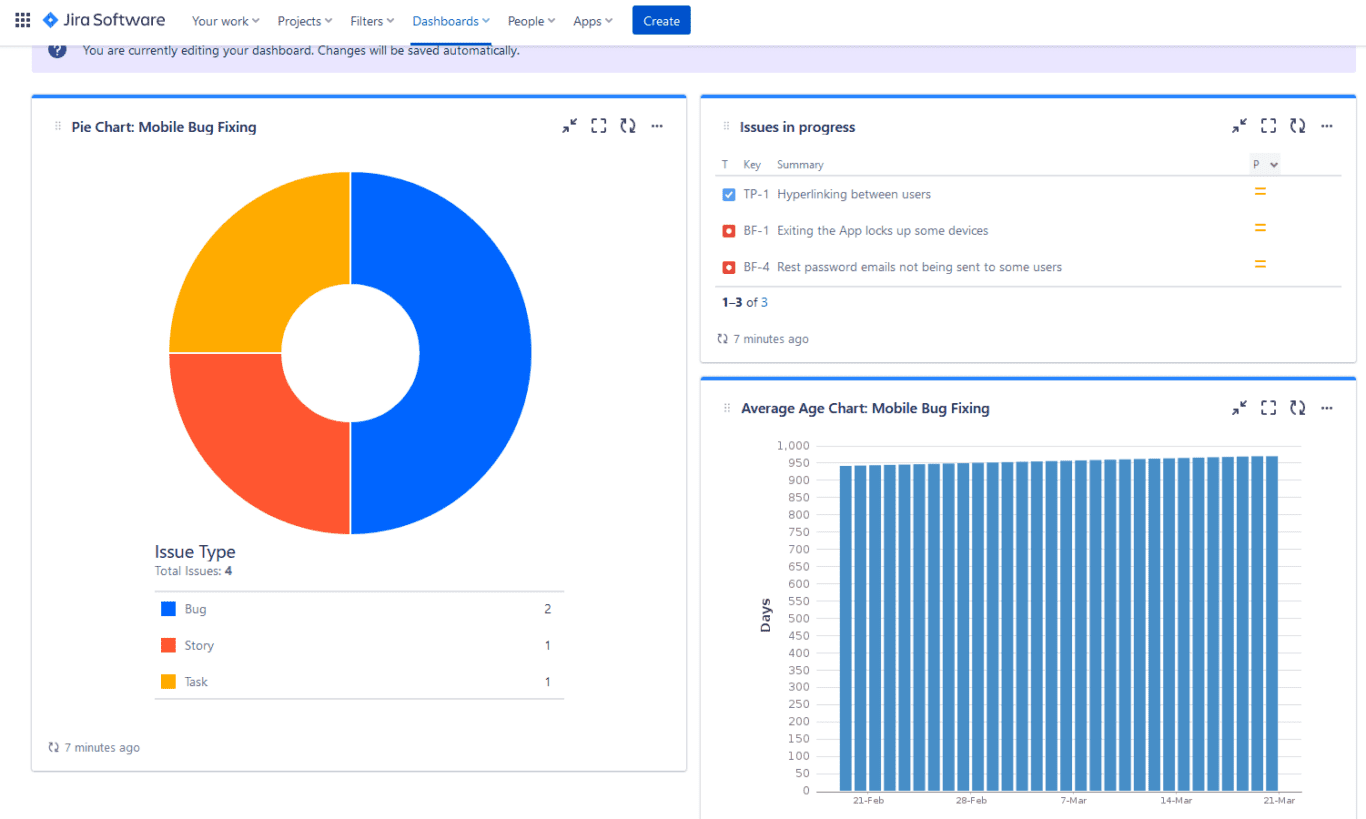
Building your new dashboard in Jira is that simple! And when you add a gadget to it, you can set it up to refresh automatically after a certain delay, meaning your data is always up to date!
Limitations of this method
So while built-in dashboards are a great Jira feature, they’re not always the best way to share important Jira data. Here’s why.
- You can only see them in Jira: You can only share Jira dashboards with your organization, groups in Jira, or project members. Need to work with people who use other tools? Too bad! You’ll have to find some way to export your Jira issues to another tool.
- They only take in Jira data: Sure, this isn’t a limitation if you only want to share Jira reports and dashboards within Jira. But if you’re working on cross-functional projects with other teams, you might want to show this data as a piece of a greater whole, which means you’ll need data from multiple tools in a single dashboard.
- They might not have the visualizations you need: Jira dashboards do have about 30 gadgets with all sorts of visualizations, but you can bet it’ll probably be missing the one you need to get all the data points your boss asked for.
Jira’s built-in dashboards definitely get points for how quick they are to set up, but they’re still not the best solution for every purpose. So what’s the other way?
Second method: Create custom Jira dashboards with Unito
Unito is a no-code workflow management solution with some of the deepest two-way integrations for the most popular tools on the market, including Jira, Google Sheets, Asana, Excel, GitHub, and more. With a Unito flow, you can automatically sync Jira issues with custom dashboards built into tools like Google Sheets, Excel, Airtable, Notion, and more.
The best part? Whenever that Jira data changes, it’ll be kept updated in both tools. Here’s why Unito is the best way to build dashboards for Jira issues:
- They’re more shareable: Tools like Airtable and Notion let you customize who has access to your dashboards, even if they’re not working in these tools. That means you can create read-only views of your dashboards that anyone can see, even if they don’t have an account for the tool you choose.
- They can take in all sorts of data: You’re not stuck with Jira data. If you’re working on a bigger project that needs to pull in data from multiple tools, you just need a few Unito flows to keep it all in one place.
- You get the visualizations you need: Instead of being limited to Jira’s gadgets, you can use a dedicated database tool like Airtable and Notion to build the exact dashboard you need and trust Unito to fill it with your data. And since Unito supports custom fields for most integrations, you’ll be able to customize your dashboards to your exact specifications.

Need help making your dashboard?
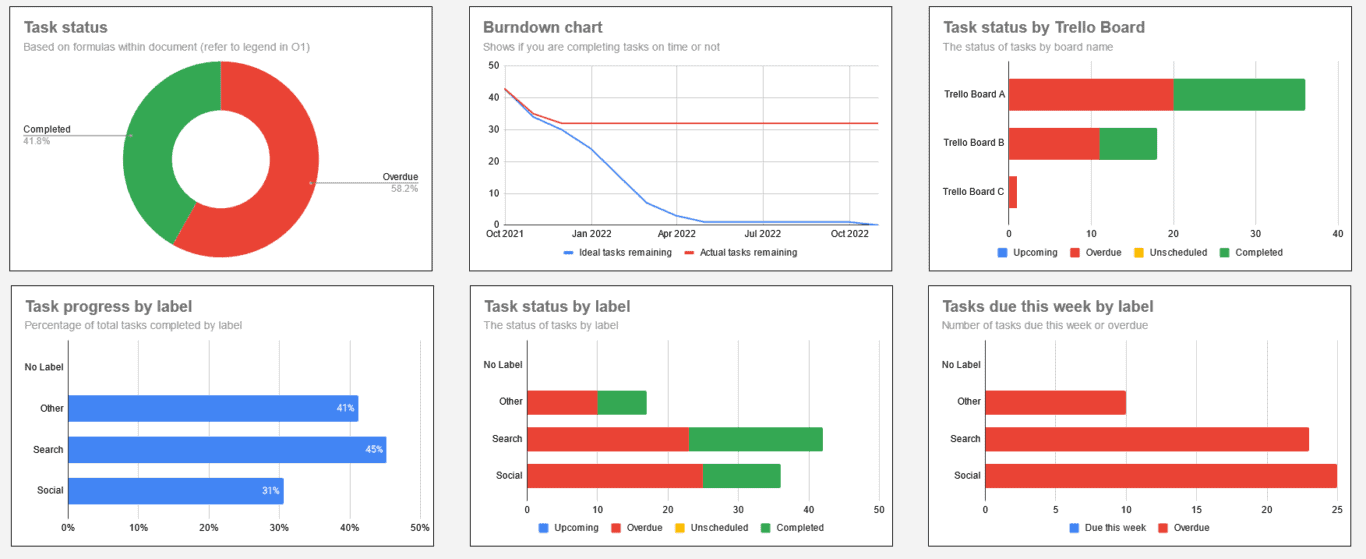
Unito’s Project Progress Report template is perfect for creating a Jira dashboard that communicates a project’s progress with burndown charts, sprint velocity graphs, and more.
You can get this template for Google Sheets and Microsoft Excel.
Ready to start? Here’s how you can build the Unito flows you need to make your Jira dashboards work, using Google Sheets as an example.
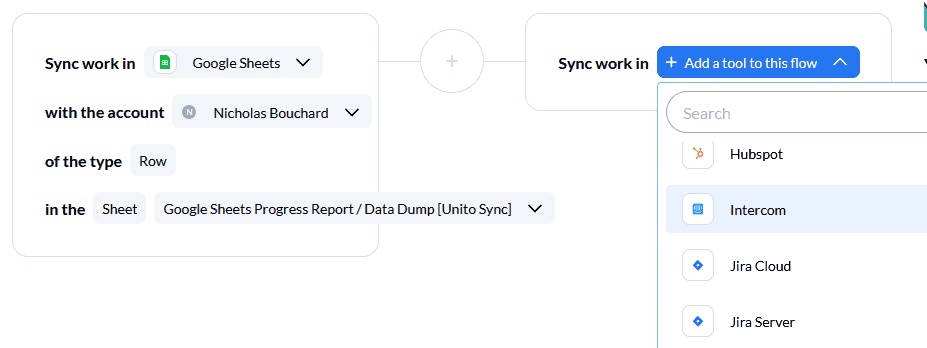
- First, connect Jira and Google Sheets to Unito.
At this stage, you’ll also pick the Jira project you want to pull data from and the spreadsheet your dashboard will be in.
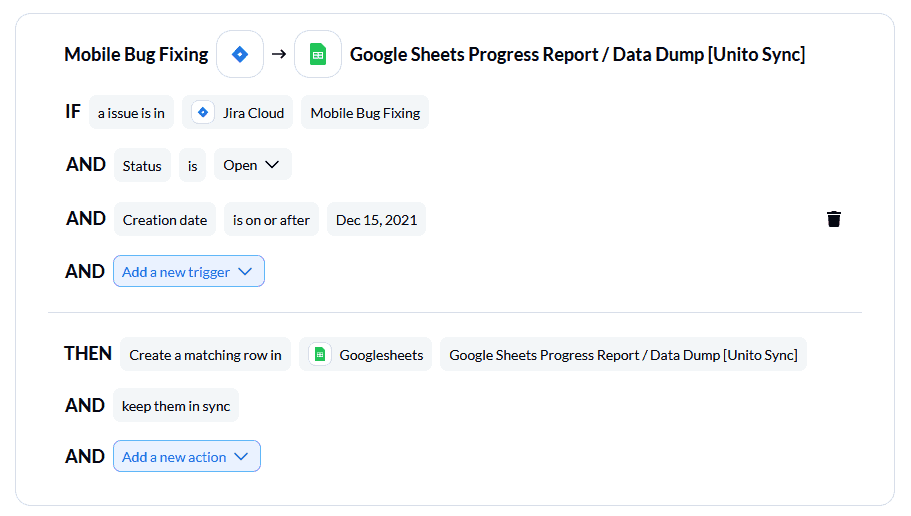
- Use rules to filter out the Jira issues you don’t want in your Google Sheets dashboard.
With Unito rules, you can exclude specific issue types, issues with certain assignees, and more.
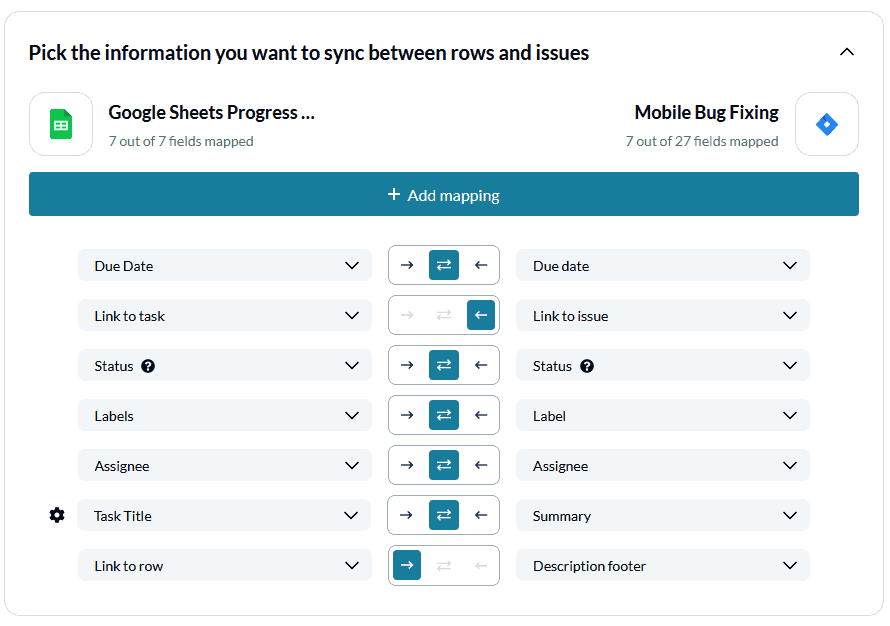
- Now map your Jira issue fields to fields in Google Sheets.
Field mappings tell Unito where your Jira data needs to go. That means matching up column headers in Google Sheets with fields in Jira issues.
And that’s it! Now launch your flow and watch as your new Jira dashboard is automatically populated with data.
Examples of tools you can use for your Jira dashboard
The best tools to manage dashboards full of Jira data will usually be spreadsheets or dedicated databasing tools. Here are just a few examples of tools that you might use for your next Jira dashboard — and what Unito’s integrations for them can do.
Notion
Notion is an all-in-one tool that lets you build just about anything, making it a great option for making a Jira dashboard. Unito’s integration can automatically pair Jira issues with Notion pages, keeping everything in sync.
Airtable
Airtable is often used as a databasing tools for everything from sales to marketing and yes, even product. By loading up an Airtable base with Jira data using Unito, you can use it as a powerful dashboard for your projects.
Google Sheets
This spreadsheet tool is easy for just about anyone to use, which is why it’s a popular choice for dashboarding and reporting. Unito’s integration for Google Sheets and Jira makes this even simpler.
Microsoft Excel
They say the world rests on Microsoft Excel’s shoulders, and it’s no surprise why. It’s the most popular spreadsheet tool, especially with enterprise-sized organizations. Unito’s integration for Excel and Jira syncs data seamlessly between the two tools, creating a frictionless dashboard.
Watch a demo video sync Jira projects to Microsoft Excel
Here’s how you can achieve a similar workflow that sends Jira project information into a Microsoft Excel spreadsheet:
Want to see what this integration can do?
Meet with our team to see how Unito can transform your projects.
FAQ: Jira dashboards
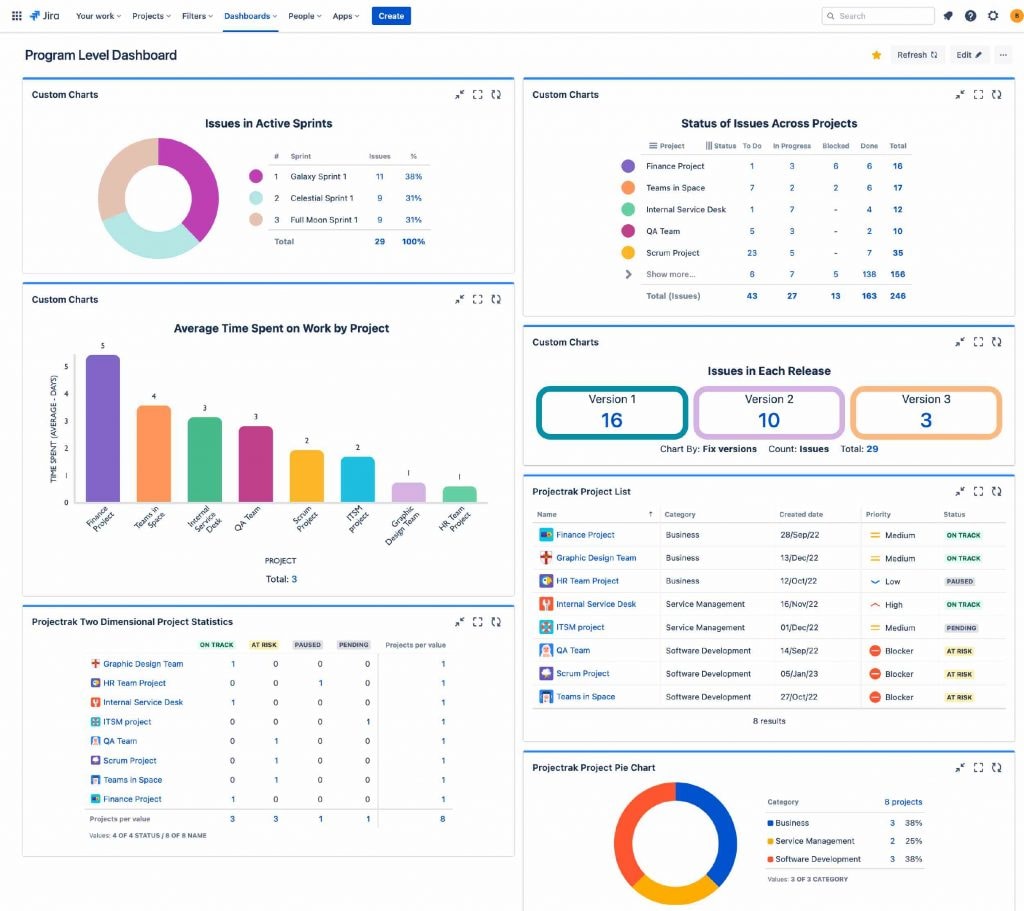
What is a Jira dashboard?
A Jira dashboard is a custom view that lets you represent data from multiple projects in one place. By adding what Jira calls “gadgets,” you can customize the charts, graphs, and lists on your dashboard. Some examples of these Jira dasboard gadgets include:
- Issues in active sprints
- Issue status across projects
- Average time spent on work by project
- Issues in each release
- Issue statistics
- Pie charts
It might seem a bit overwhelming at first, but you can easily iterate on your dashboard to keep just the gadgets you need.
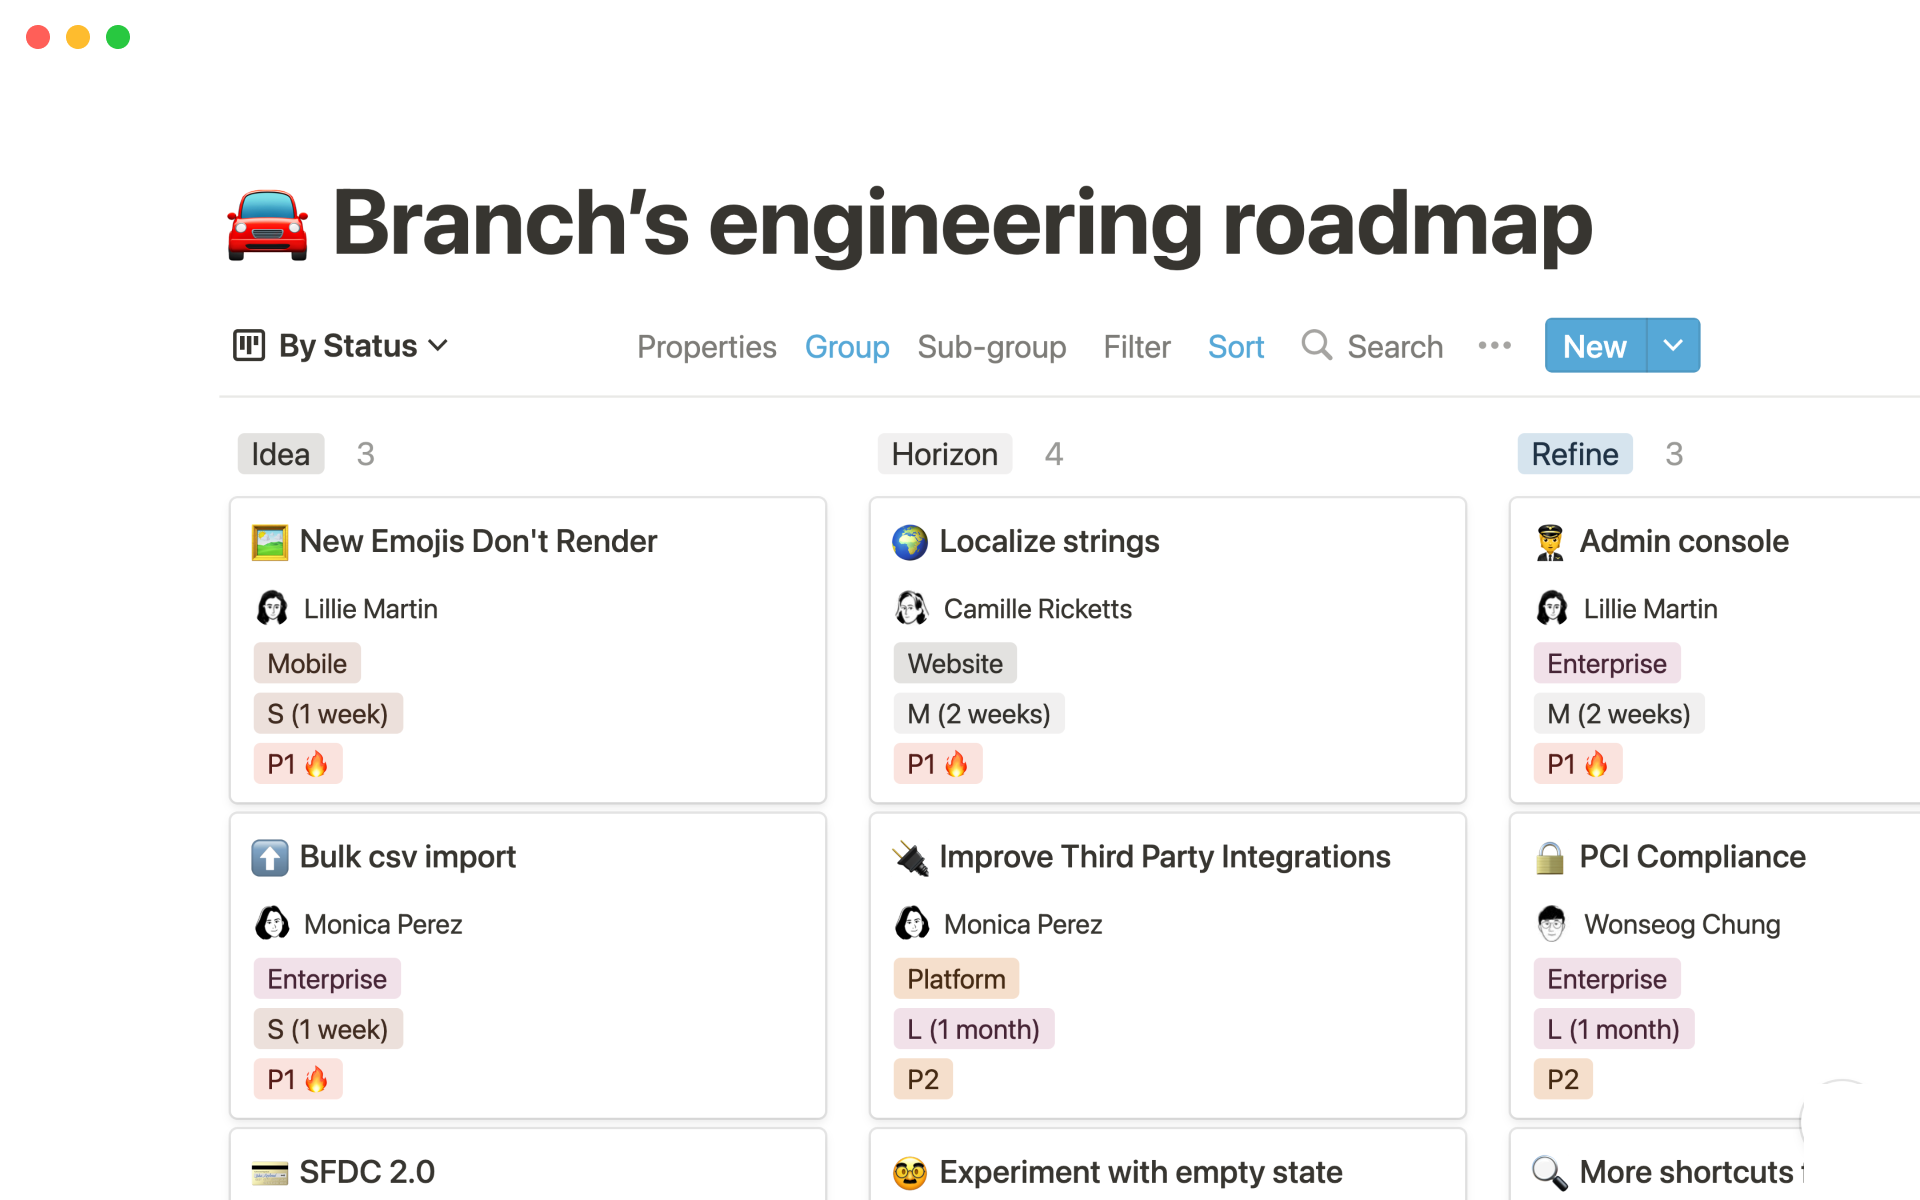
What’s the difference between a Jira dashboard and a Jira board?
A Jira dashboard allows project managers to build a custom view full of data pulled from multiple projects. It might show issues in a list or similar views, but the primary goal is to get a broad overview of Jira issues across multiple projects.
Compare this to a Jira board, which is a Kanban board that lists the issues for a single project.
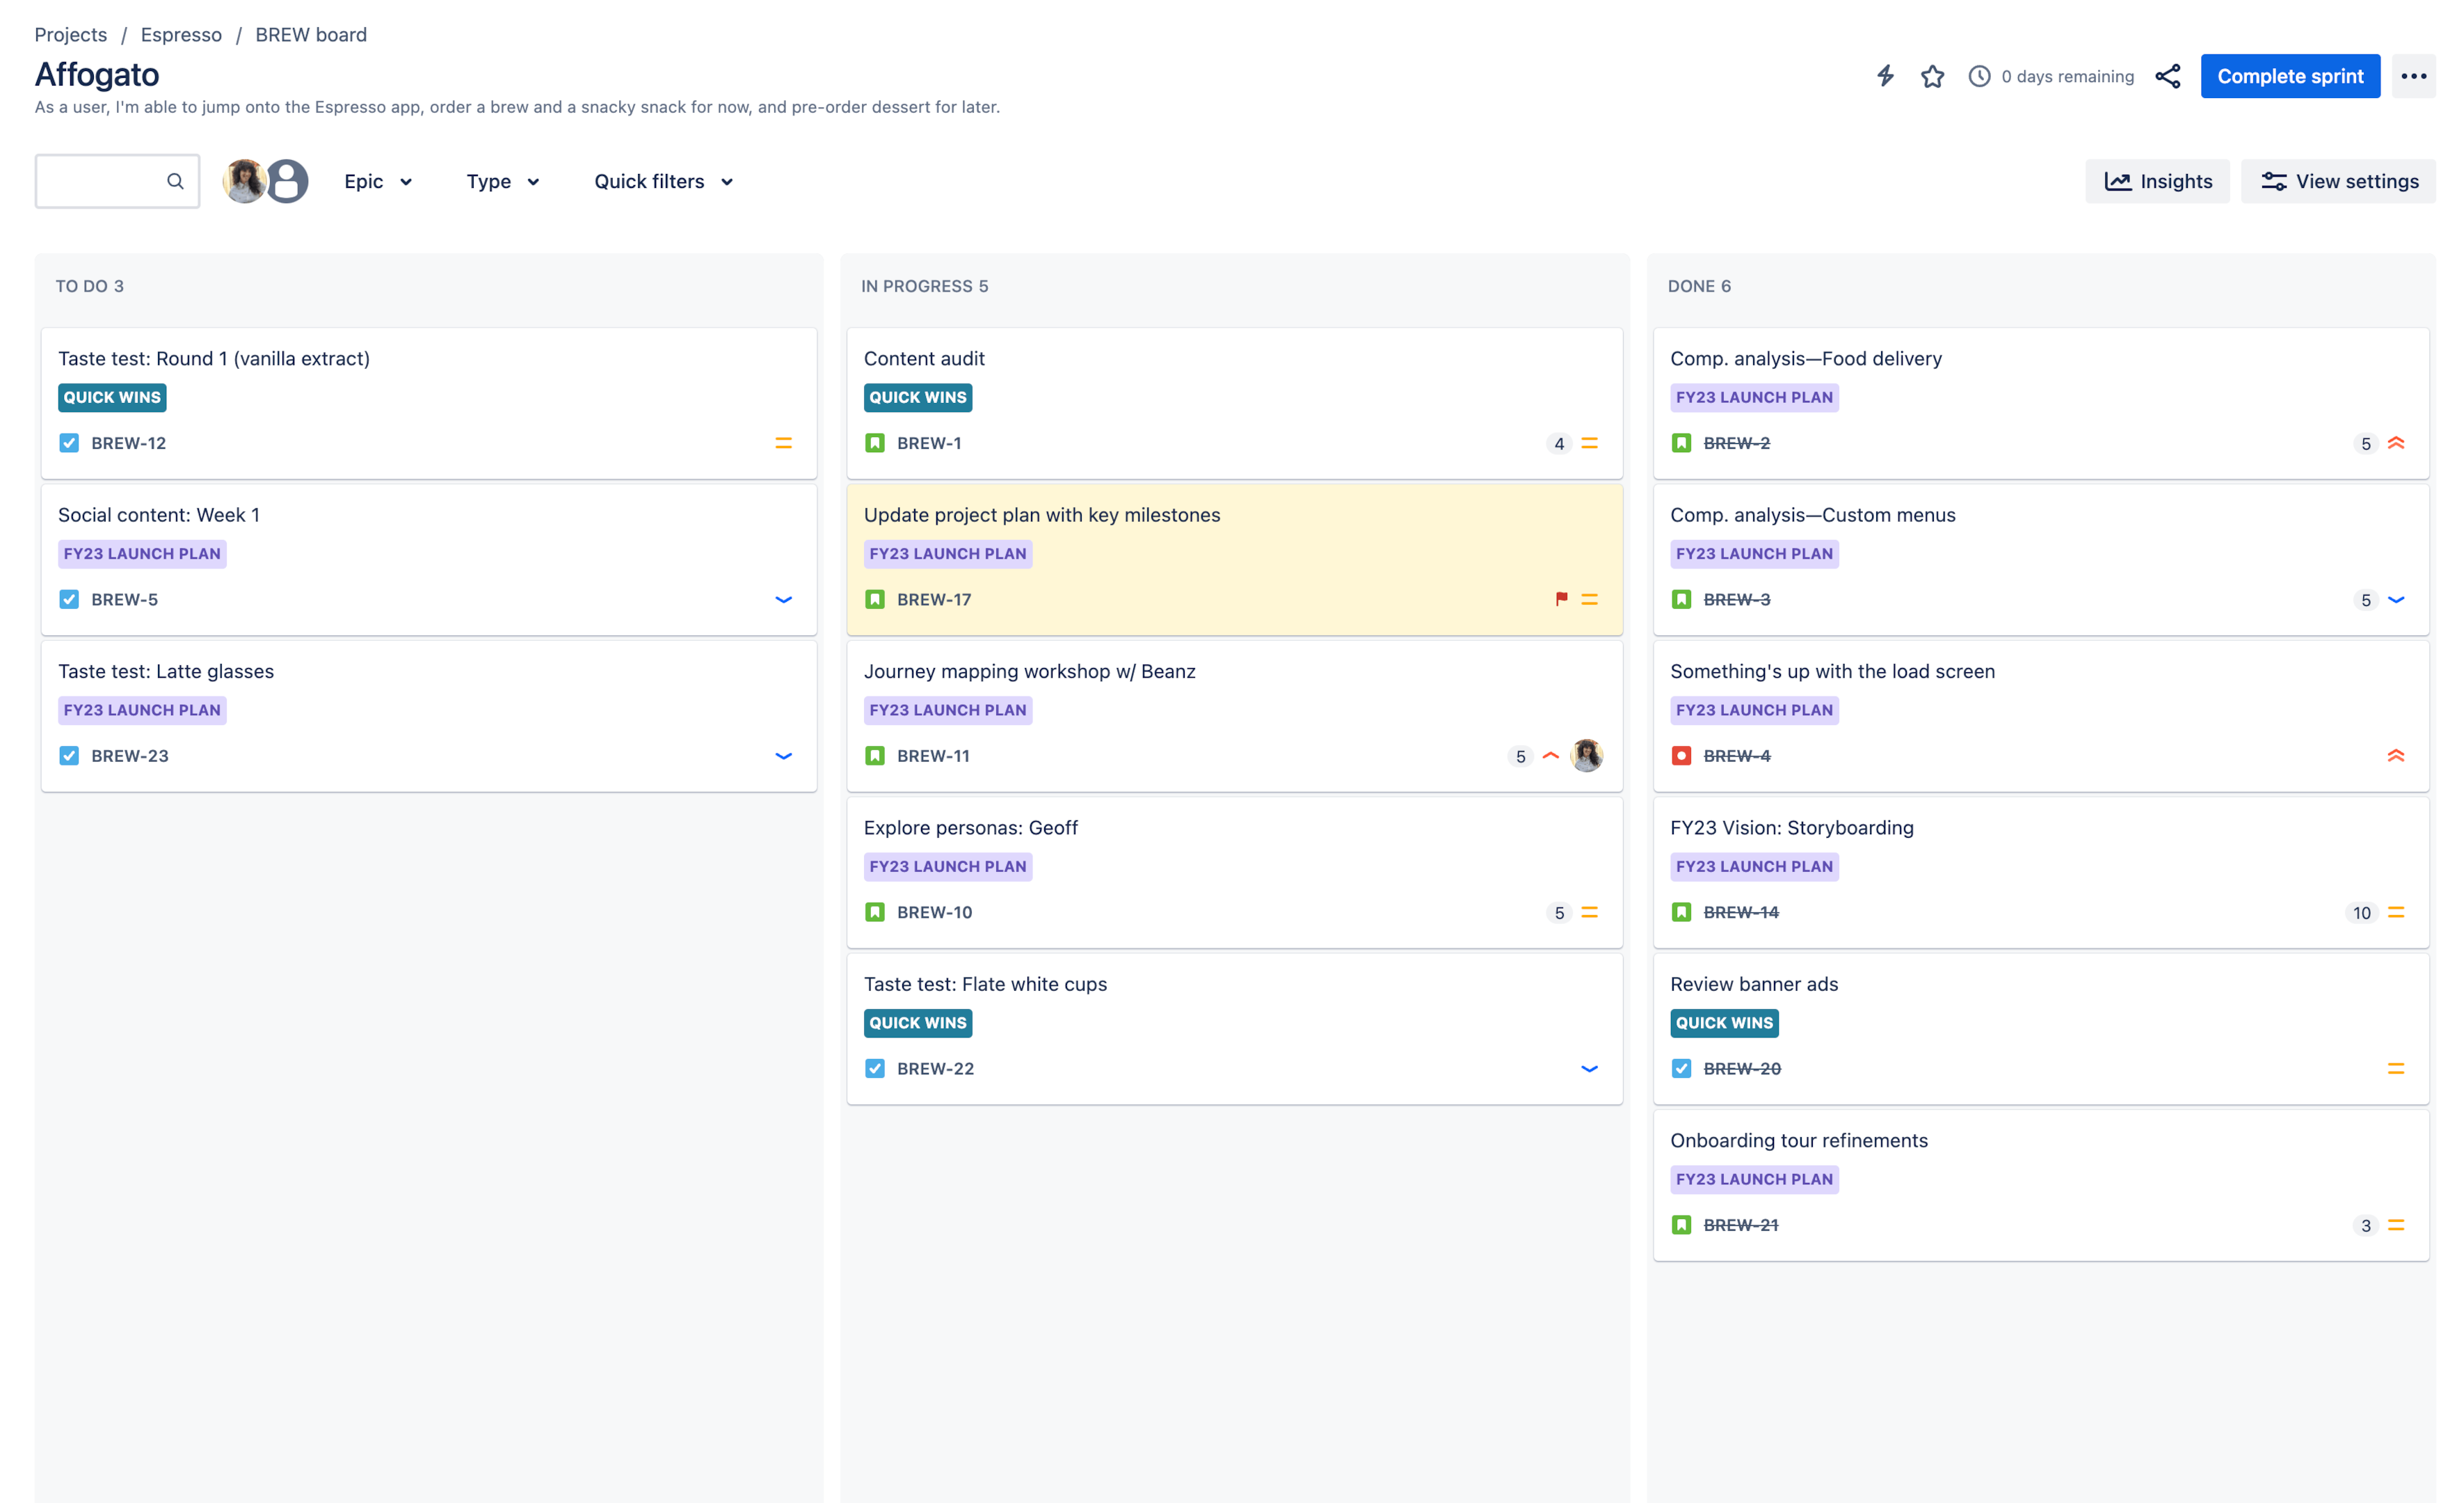
A project manager might use this Kanban board to review the issues in that one project, get a quick sense of what still needs to get done, and so on.
How do you set up a Jira dashboard?
You can build dashboards in just a few steps:
- Click on the Dashboards tab from the bar at the top of your screen.
- Hit Create dashboard.
- Pick the gadgets you want to add to your dashboard, like issue lists and pie charts.
And if you want to feed your dashboard with data from multiple Jira projects—or other tools—you can use Unito’s integration for Jira to build a simple two-way sync.