
5 Ways You Can Automate Your Spreadsheets
Spreadsheets are powerful on their own, but you can do so much more with them with the right automation. Here are five ways you can transform your workflows with automated spreadsheets.

Automated Reports: What They Are and 13 You Need
Automated reports allow you to share information about a team, a project, or even a whole organization without a ton of manual work. Here’s how.

Why Automated Reporting Templates Are Essential To Your Workflows
Reporting is essential, but it can take hours to get right. Unless you use an automated reporting template. Here’s why.

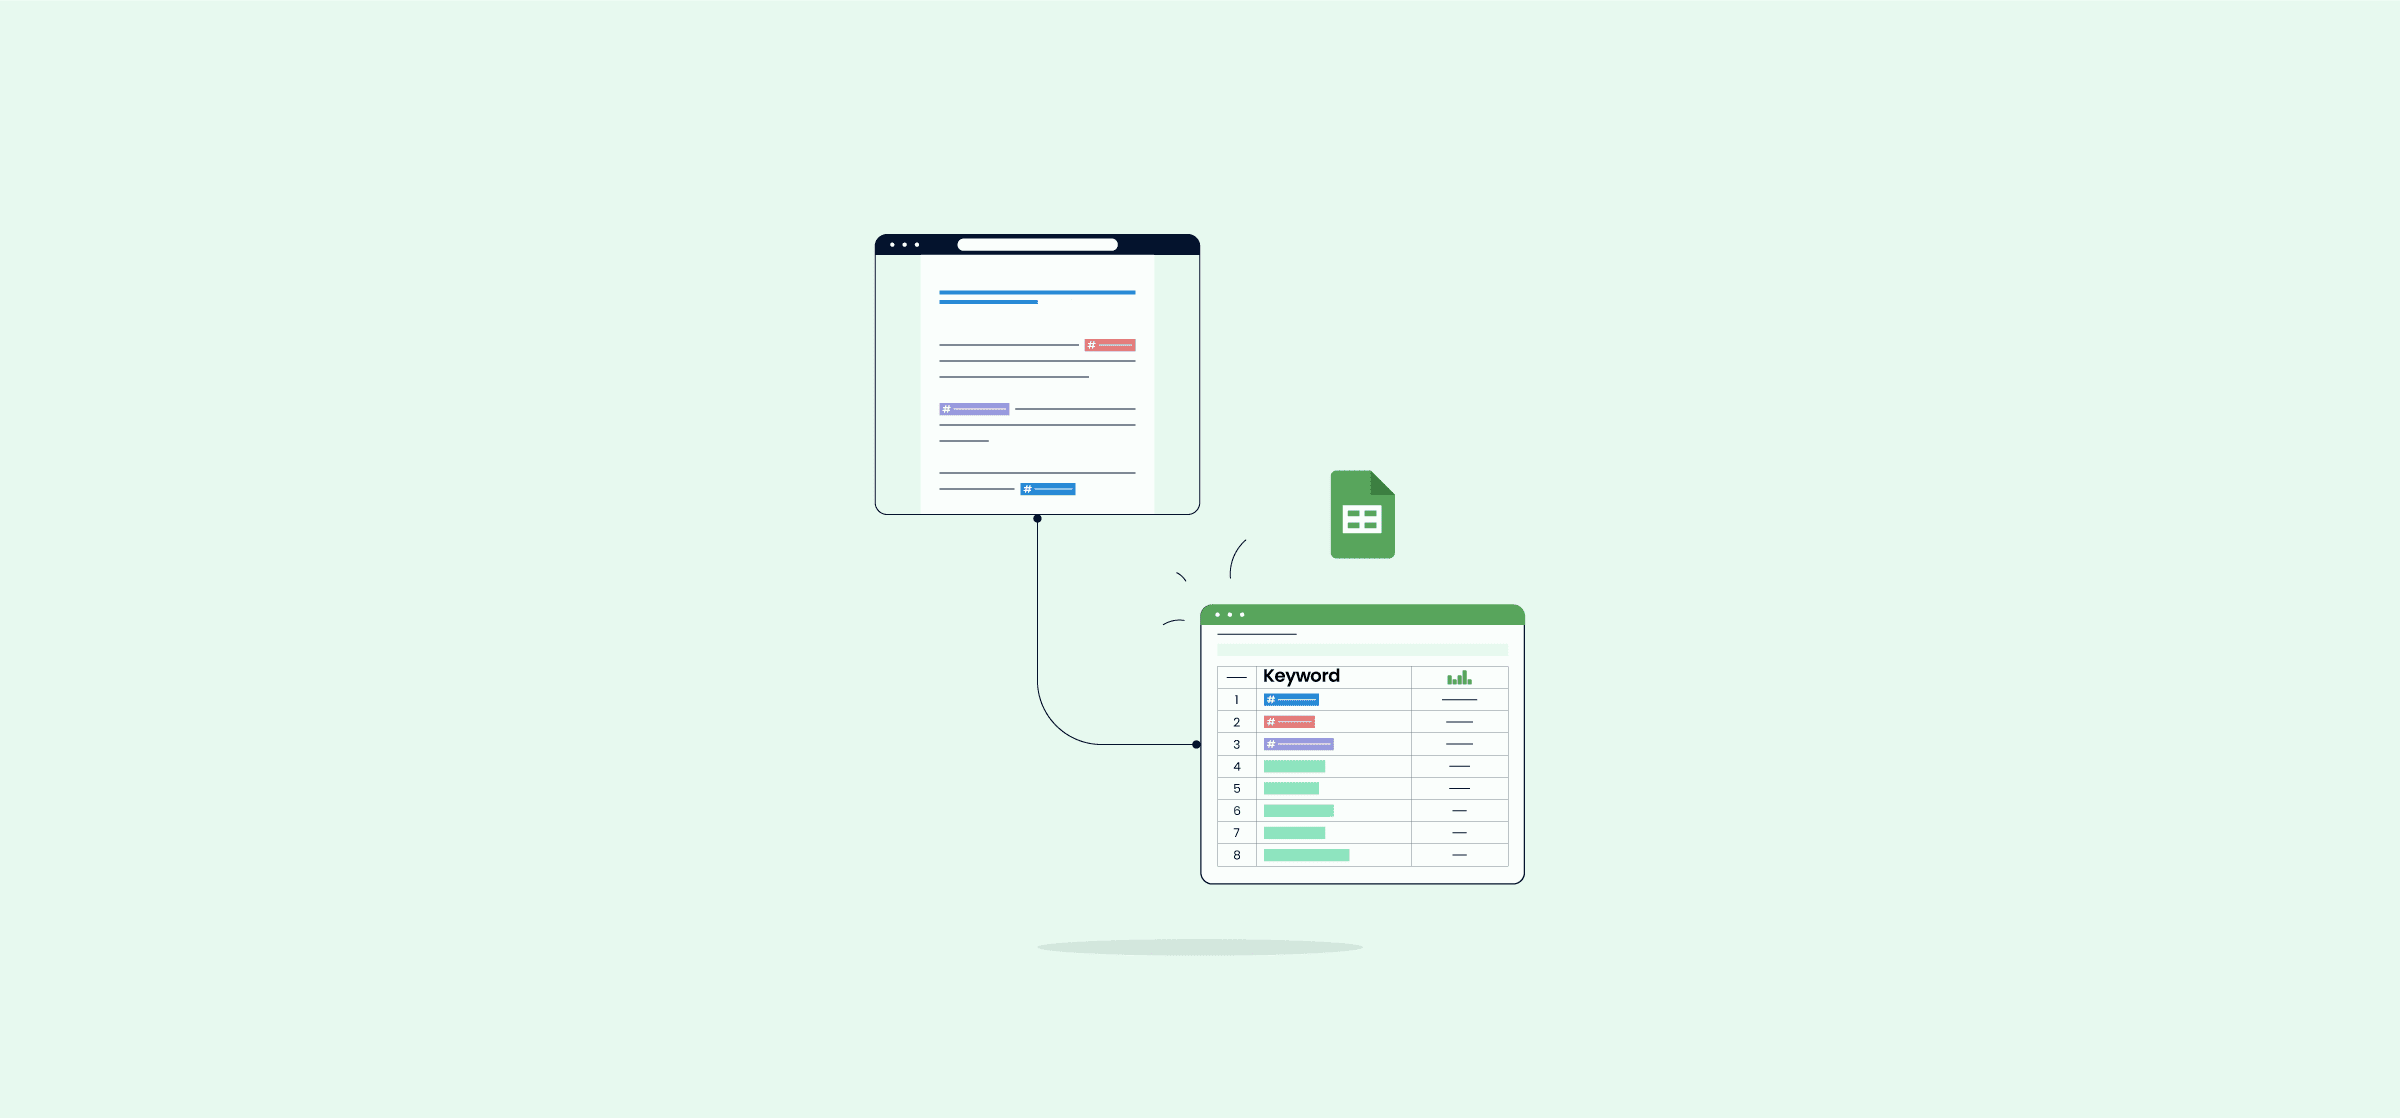
How to Export Your Trello Boards to Google Sheets (3 Methods)
Here are three methods you can use to get your Trello cards into Google Sheets. One’s manual, the other’s automatic, and the last uses a Power-Up. Find out which one’s right for you.

How Master Data Management Can Streamline Operations for All Teams
Master data management means having a single source of truth from which data flows to other platforms. Here’s why that’s important.
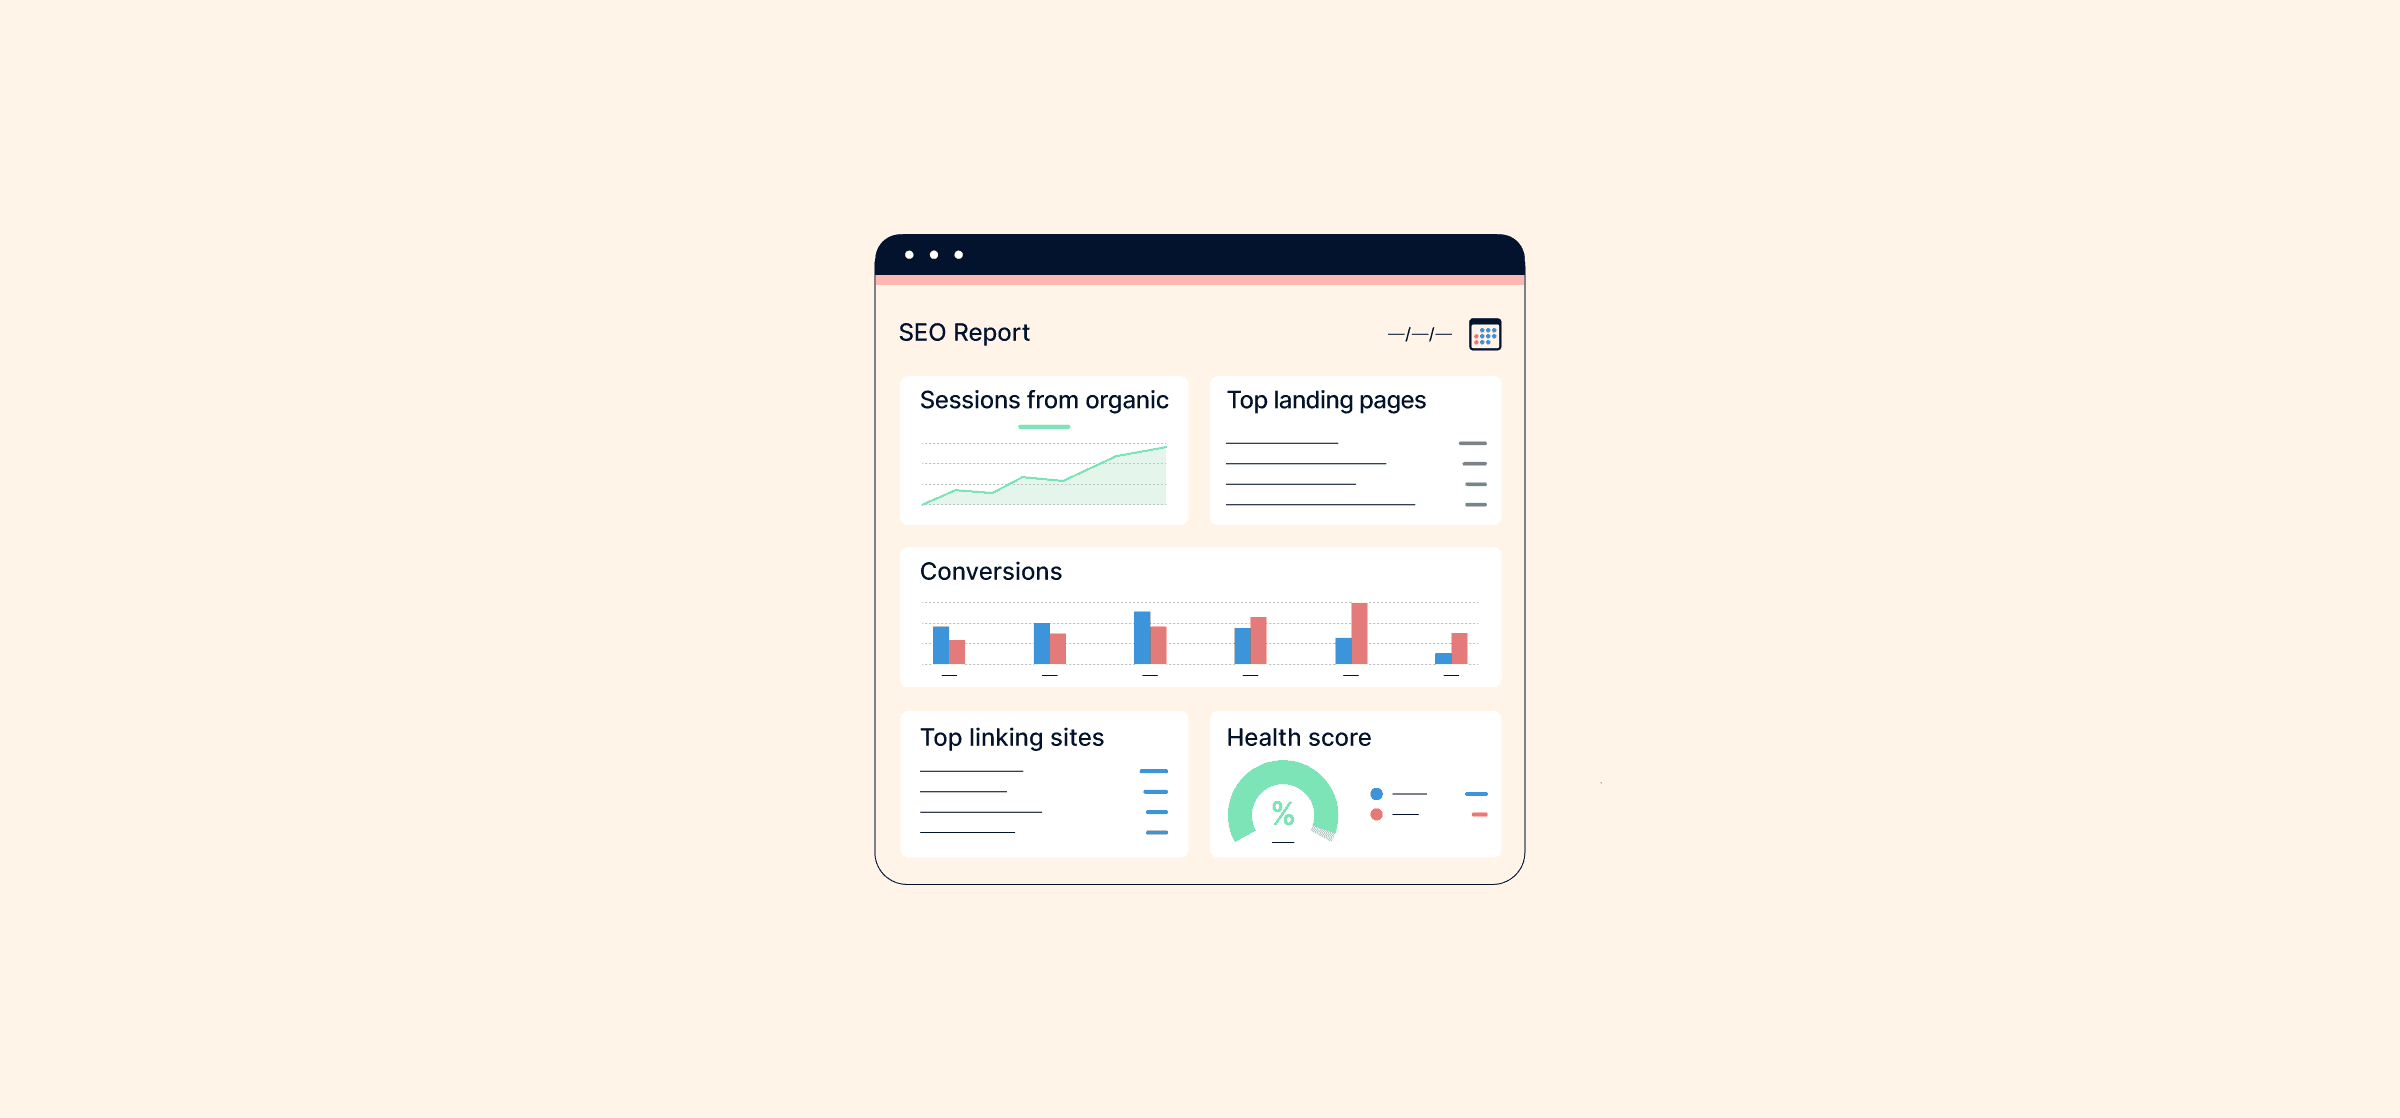
5 Free Templates for Your Next SEO Report
An SEO report will tell your team how well your website is ranking in Google search results and tell them what to do next. Here’s how to create your own.

How to Combine Data From Multiple Excel Sheets (2 Methods)
You can combine data from multiple excel sheets through Excel’s built-in consolidate feature or with a platform like Unito.

How to Boost Asana Reporting with Looker Studio, Google Sheets, and Unito
If Asana reports aren’t quite doing it for you, here’s how you can get more out of them by pushing data to Looker through Unito and Sheets.
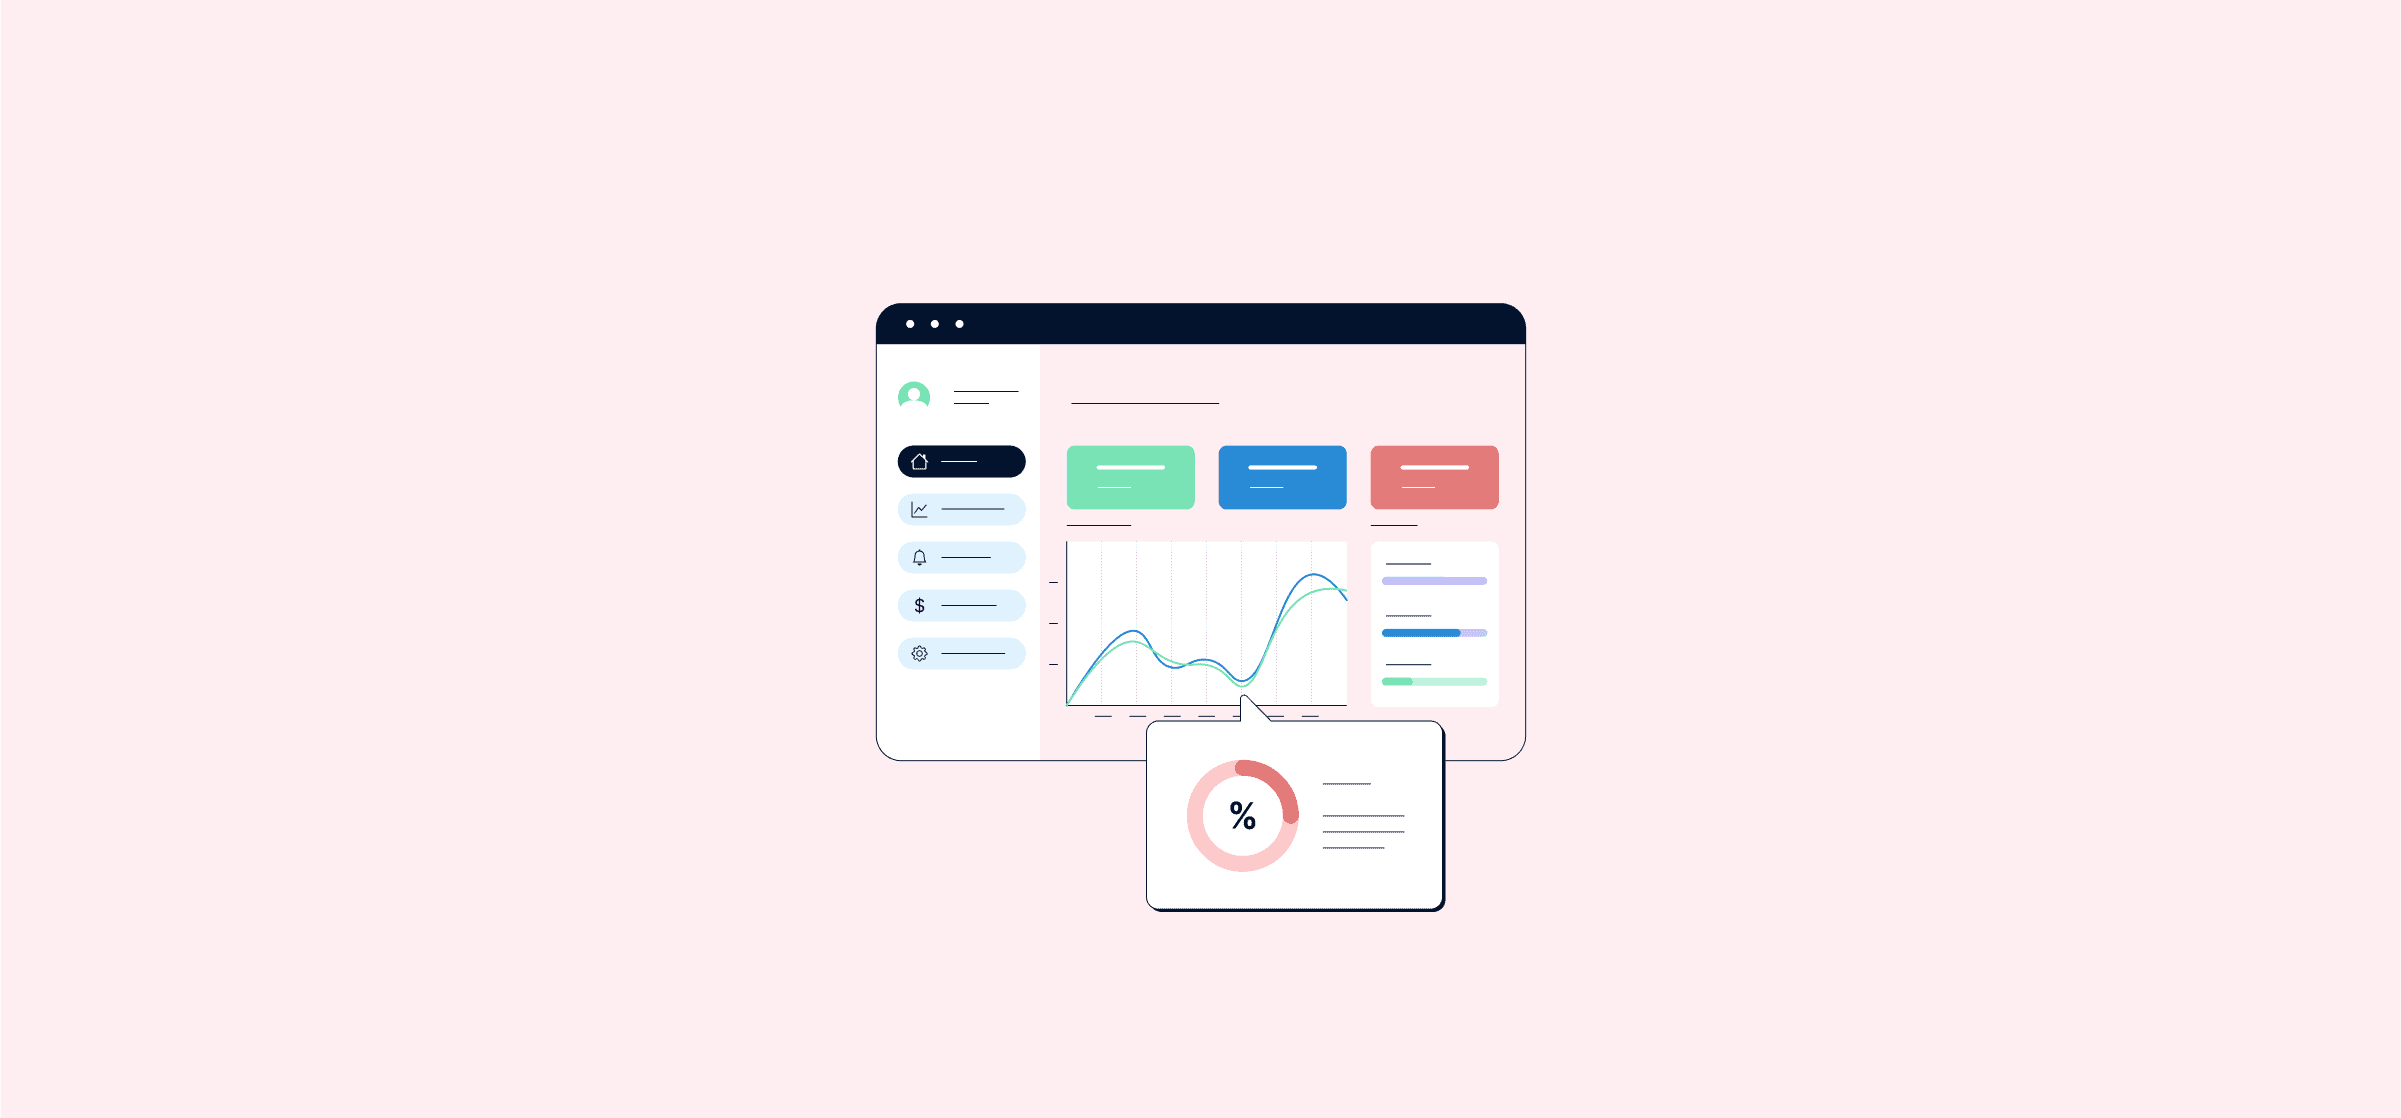
What Is Dashboard Reporting?
With dashboard reporting, your teams can get real-time data on just about any part of their work. Here’s how.

The Best Examples of Marketing Reports and KPIs in 2023
Marketing reporting lets marketing teams use data to make better decisions, focus on the right initiatives, and get more results.
The Ultimate Guide to Automated Reporting
With automated reporting, you can build reports faster and more accurately than you could manually. Here’s how that works.