
Automated Reports: What They Are and 15 You Need
Automated reports are the best way to get important information about projects, teams, and even the whole organization to the right place with a minimum of manual work. They can be created with purpose-built tools, spreadsheets powered by the right automation solution, and even project management tools you’re already using. But what goes into an automated report? And what are some essential examples of these reports?
Let’s dive in.
What is an automated report?
A report is a document that’s created to transfer information about a project, a team, or even a whole organization from one party to the other. The entity — a single person, a team, or a business — creating the report has information that the received doesn’t, and the report’s goal is to send that information as efficiently and accurately as possible.
Reports can be created for all sorts of reasons, from sharing the progress of an important project to communicating a team’s workload. Some reports are multi-page documents created in word processors while others are more dynamic, built using dedicated tools that keep data updated in real-time.
Most reports can be turned into an automated report, meaning that their creation happens automatically, data is pulled from multiple sources without any manual work, and anyone who needs to know what’s in the report can check it at their convenience.
How can you build an automated report?
While it can take a bit more work to set up an automated report than write it manually, it pays off massively in the long run. That’s because you usually only need to set up an automated report once, then refer to it again as needed. That means a single automated report can potentially replace dozens of manual ones.
There’s more than one way to build an automated report. Here are just a few:
- Pairing your tools with the right integration. One of the biggest challenges of reporting is pulling data from multiple sources. Done manually, this can take hours. But with a platform like Unito, you can automatically sync data in both directions between tools, meaning that your reports are updated in real-time as work happens.
- Features built into tools you’re already using. Project management tools like Asana have a ton of great features for building automated reports, but they’re not the only ones. SEO tools, CRM platforms, and a ton of the other tools you’re using already have some really useful ways to automate your reports.
- Using automation: Like an integration solution, automations can push data from the tools you need to report on to the tool you’re using to build your report. The main difference is that automations can’t sync data. That means can’t really build dynamic dashboards with automation, but you can at least get your data from tool to tool.
Why you should automate reporting in your organization
While spreadsheet tools and the like are great for creating reports, they usually involve a ton of manual work. When you automate your reports, you can get the same valuable data and the same crucial insights at the click of a button. You can automate every step of the reporting process, from gathering and organizing data to analyzing trends.
With automation, you’ll also eliminate human error. No matter how attentive people are, there’s always a mistake or two that slips into your reports. But when you automate your reporting workflows, you get reports that are error-free.
One other big advantage of automated reports? They save a ton of time. Compiling data and filling out spreadsheets is hardly the best use of anyone’s time. Automate your reporting workflows and you’ll free up your teams to work on high-value tasks that need that human touch.
Automated reports for all teams
No matter what team you’re a part of, these are some reports you’re likely to run into during your day-to-day work.
Risk reporting
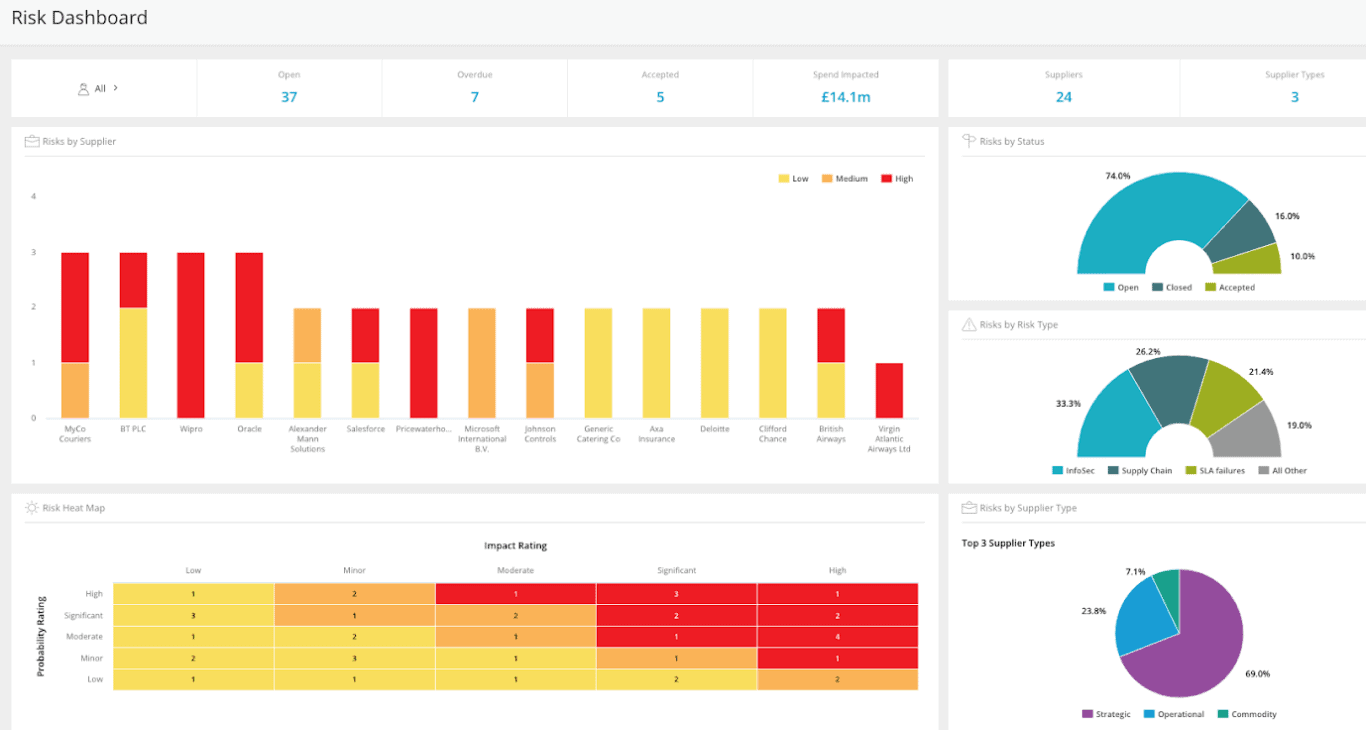
Teams and organizations alike have to deal with risk, those events that can negatively impact individual projects or the trajectory of an entire company. With risk reporting, project managers, executives, and consultants catalog these risks, evaluate how likely they are to impact important outcomes, and how much of an impact they can have.
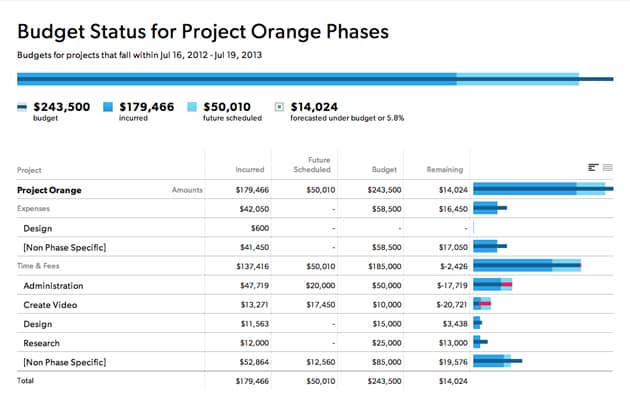
Budget reports
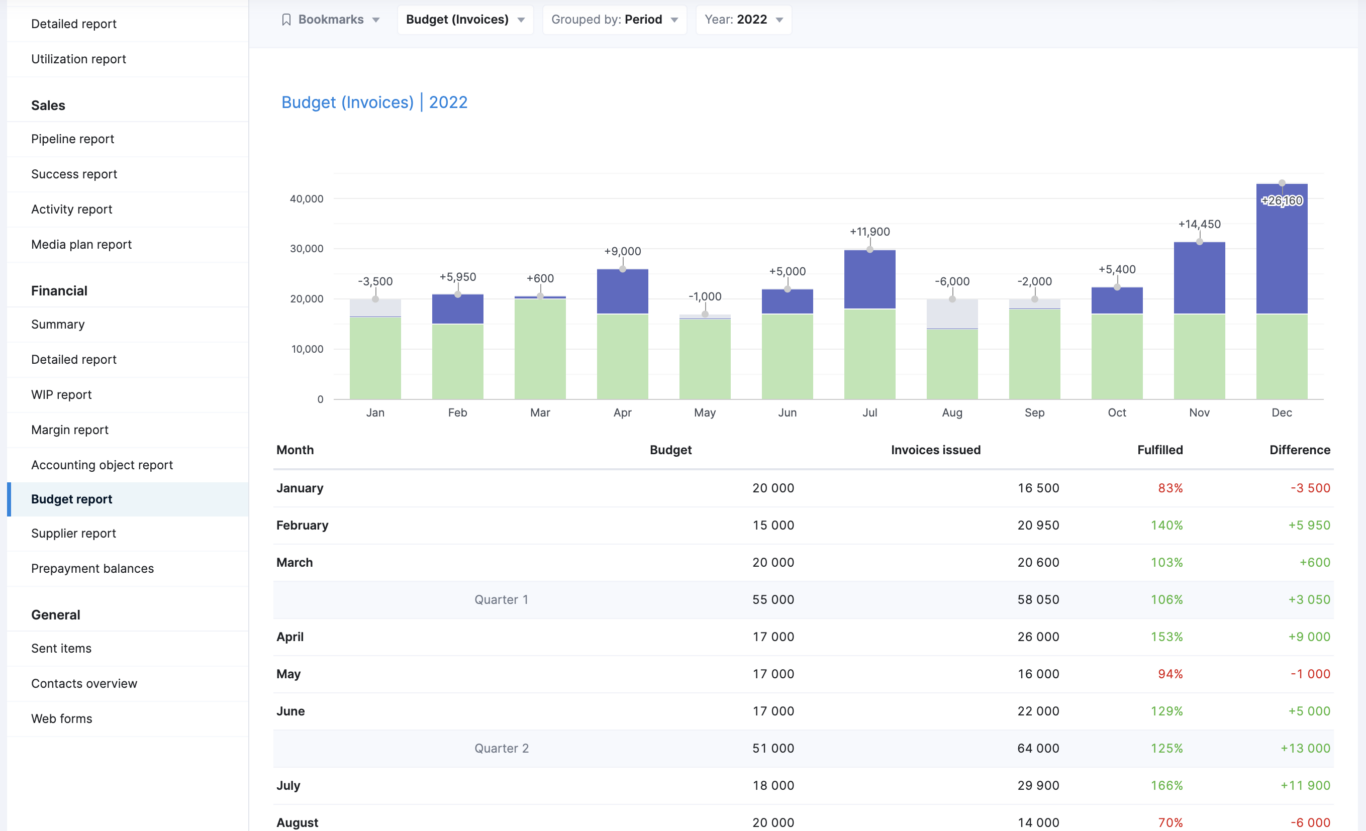
Where a resource management report is about tracking the ongoing depletion of resources for a specific project, a budget report is a bit broader. This report will track the budget of an entire team or department, and is used by stakeholders to decide which budgets need cutting and which ones need to grow. Here’s an example of an automated marketing budget report built into Airtable.
Time-tracking report
A time-tracking report tracks the number of work hours that were put into specific tasks or a specific project. Automating these reports can be as simple as using built-in features from your project management tool of choice or as complex as leveraging multiple integrations to funnel data into a single report.
Time-tracking is essential for all sorts of work, from consultants who get paid hourly to project managers who want to ensure their team is spending their time on the right tasks. Time-tracking reports can be anything from a simple spreadsheet to a dynamic dashboard, or even a feature built right into your project management tool of choice.
Timeline report
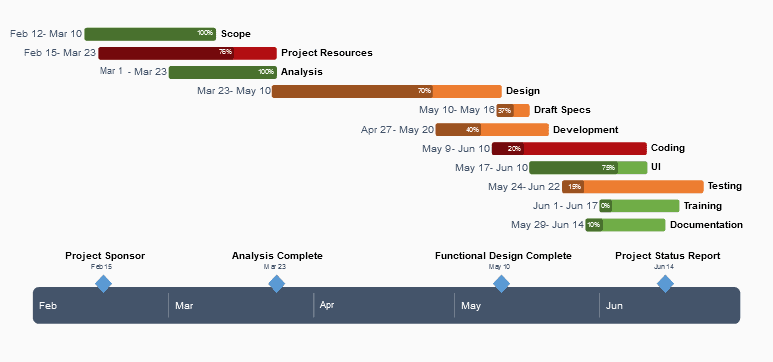
You can use a timeline report to represent any kind of data where time is a factor, from the status of a project to employee turnover and even the growth of a company. Using a Gantt chart is one of the most popular ways of displaying this kind of information, since it naturally shows overlap between dates and how different bits of data interact with each other.
Automated reports for project management
One of the main responsibilities of any project manager is reporting on a project’s progress, as well as any potential problems, resource spend, and more. That usually involves multiple reports, making the project manager the information hub for their project.
Resource management report
Managing resources appropriately is an important part of a project manager’s job. For some projects, that can mean tracking how thousands of dollars get spent. But most projects will involve tracking the hours that go into each task, especially when project managers work with teams that are spread out over multiple projects.
A resource management report tells managers, stakeholders, and teams what resources they have available for a specific project or task. These resources usually reflect work hours or budget. Here’s an example of an automated resource management report built in Airtable.
Progress report
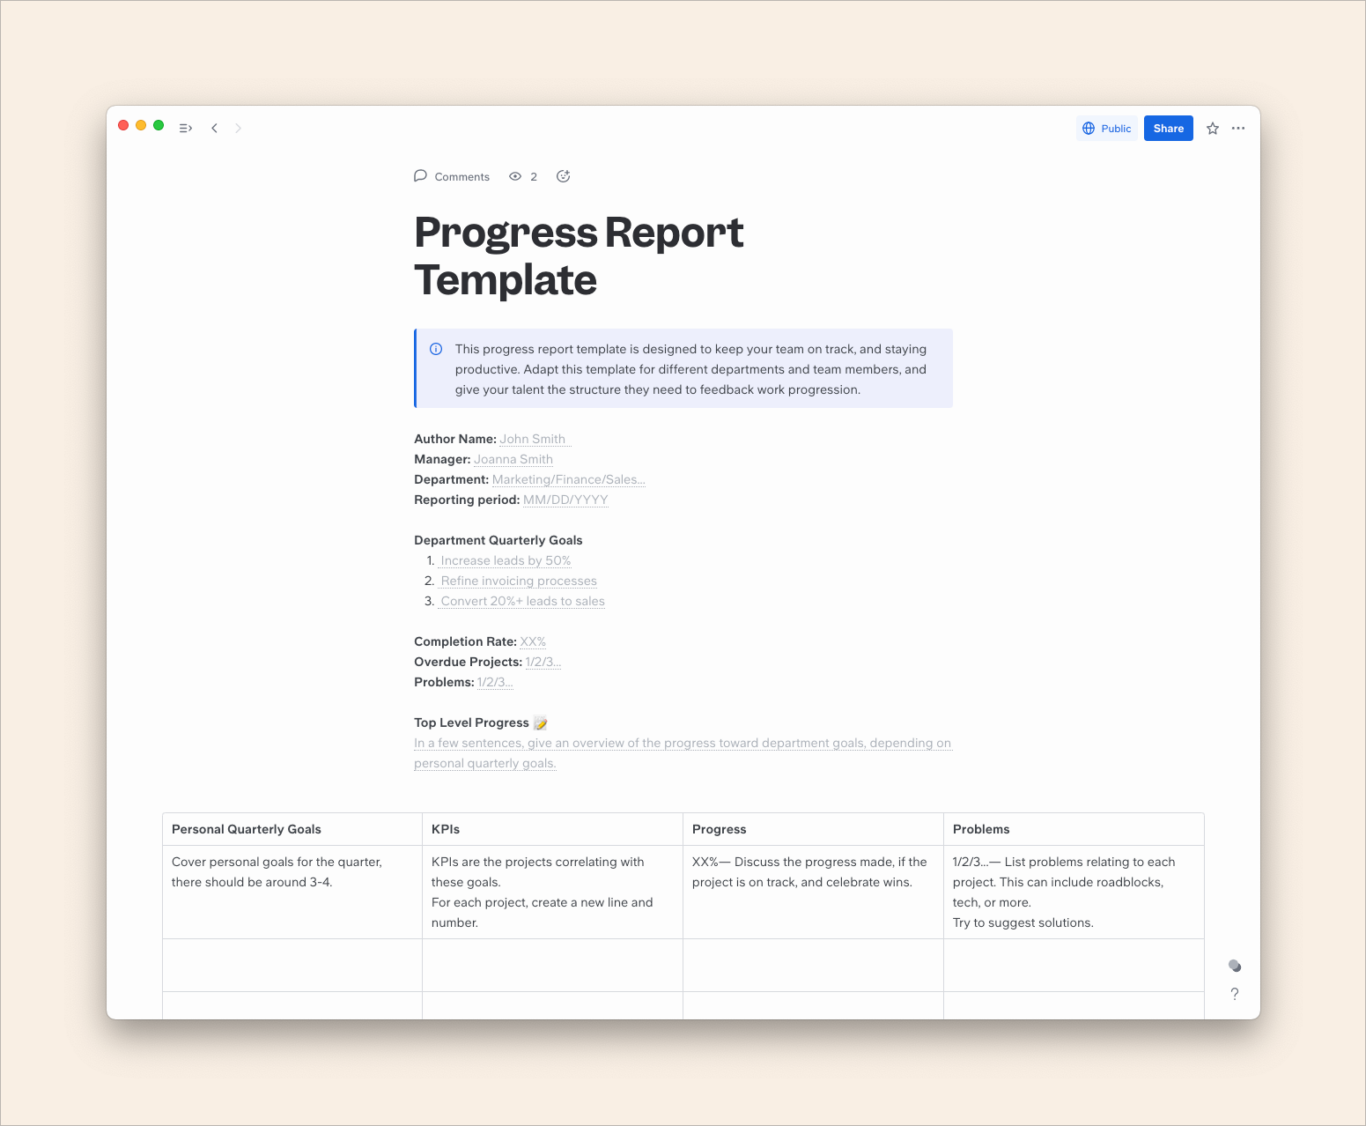
While the status quo involves manually typing out takeaways from a project’s progress, it doesn’t have to be that way. Using a spreadsheet — and the right integration — you can automate your progress reports so stakeholders always have access to the latest data. Here’s a template Unito built for doing that.
Variance report
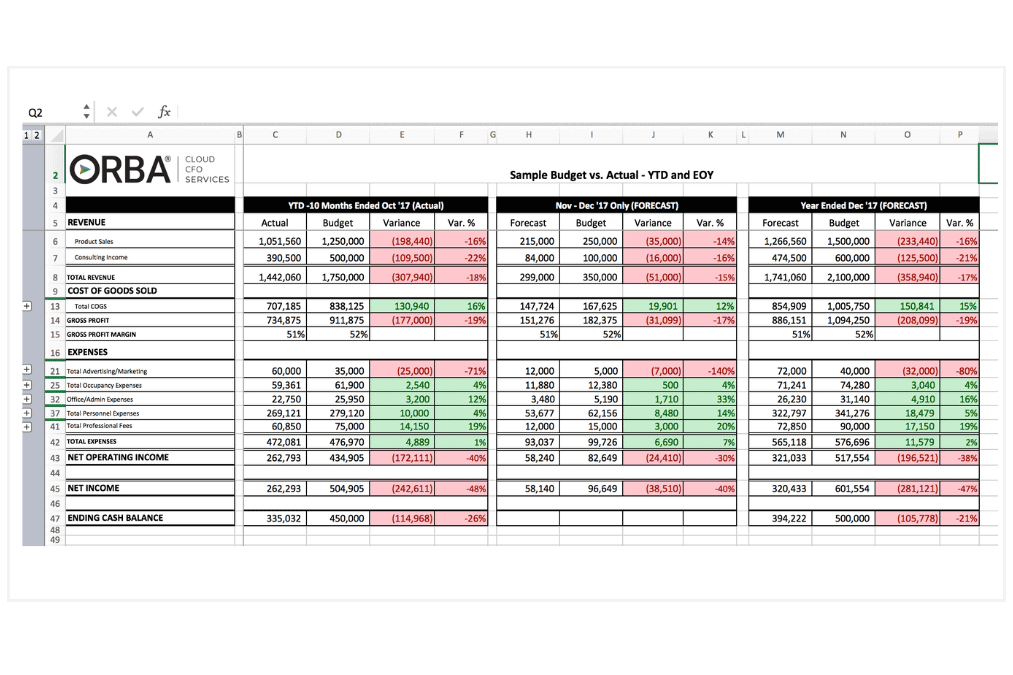
The term “variance” refers to deviation from expectations, and a variance report is how a project manager reports on projects that do just that. Whether the project has missed a few deadlines, gone overbudget, or lost some team members, a regular report can help get things back on track.
Project health report
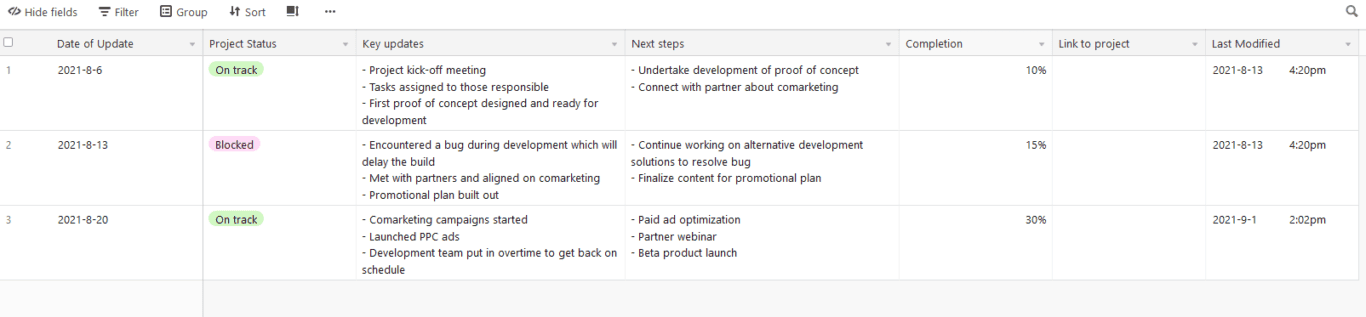
A project health report is usually a quick update on a project’s overall “health,” meaning whether it’s still progressing as it should be, or if it’s at risk. This isn’t a full progress report, just a snapshot of what’s been accomplished, what still needs to get done, and anything that’s blocked.
Want a template for automating this report? Check out this template for Airtable.
Project status report
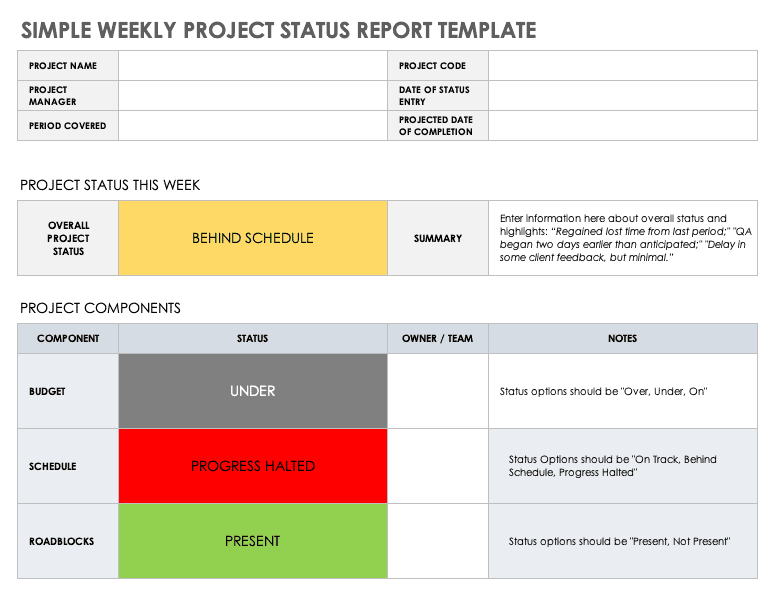
If a project health report is a quick snapshot of where your project is at, a project status report is a more in-depth look at how things are going. This kind of report will often involve input from multiple team members, quickly communicate resourcing, and even share some early deliverables.
Automated reports for marketing
Marketing teams use reports to evaluate the success of different channels, ensure they’re always bringing in more valuable leads, and keep track of high-value projects.
SEO report
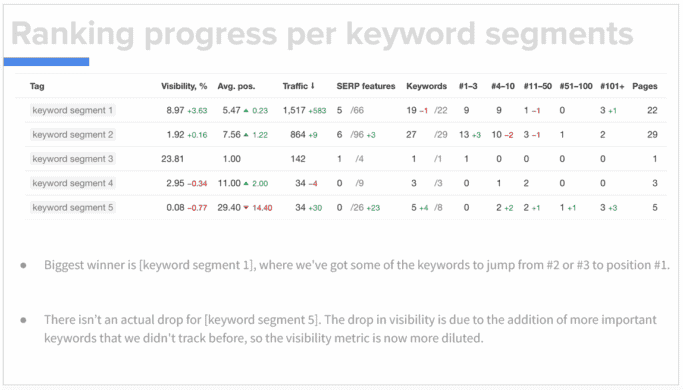
SEO reports are important for digital marketers trying to bring in organic traffic through their website and other online content. These reports often track that traffic, keyword performance, and backlinks. Many of the SEO tools marketers use have automated reports built right in.
Marketing campaign report
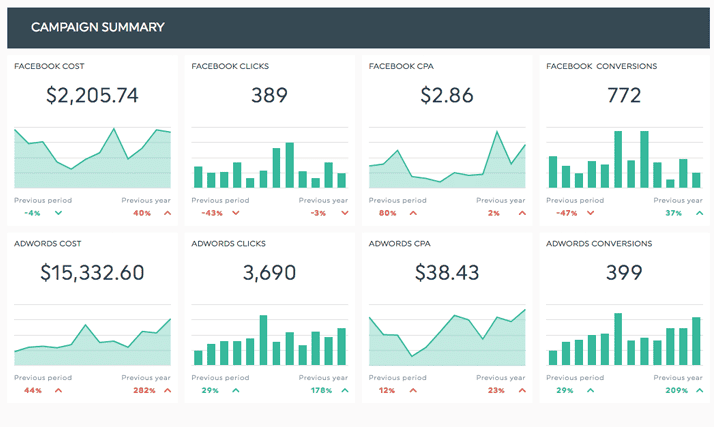
When your team is running a marketing campaign (or retargeting campaign), you need to know how effective it is. That’s why marketers will usually report on this periodically throughout the campaign’s lifetime. This can help highlight problems as they come up and ensure you’re using your marketing resources effectively.
Marketing overview report
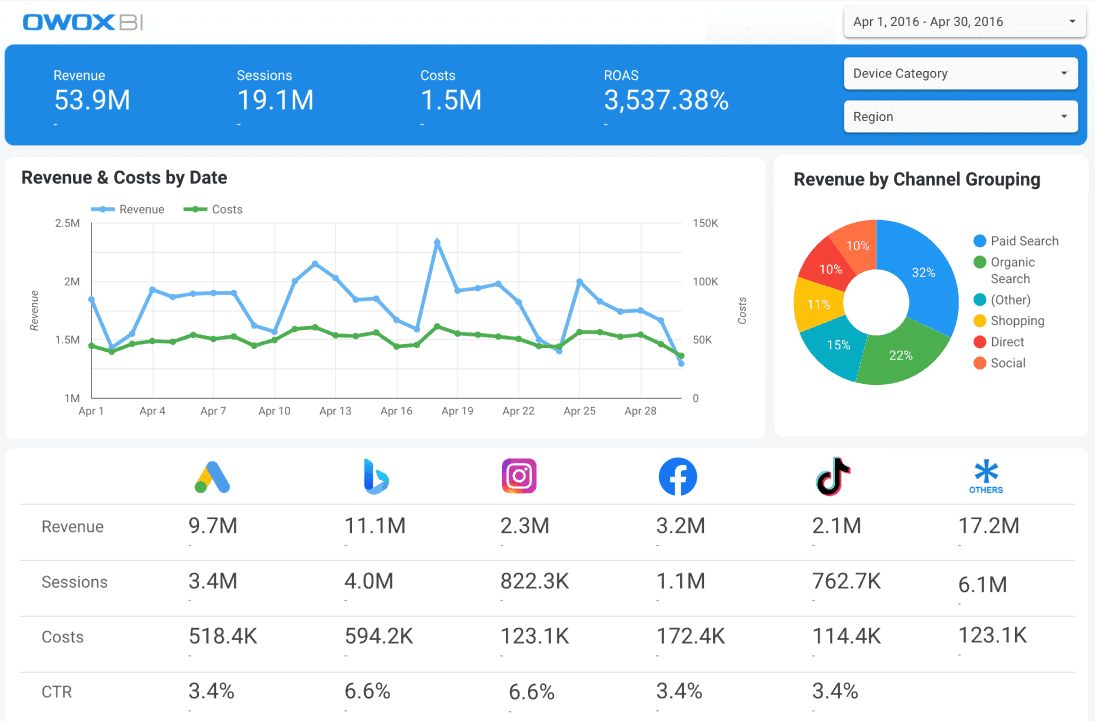
While a marketing campaign report focuses on the results of that specific campaign, a marketing overview report will cover multiple — if not all — marketing channels. The challenge is in sharing enough information to get a useful overview of your marketing efforts without creating massive reports that take hours to make. This sort of report can be automated through the marketing tools you’re already using or with the right integration solution.
Automated reports for SaaS companies
SaaS (software as a service) companies need to report on a ton of metrics to keep growing in the right direction. Automation is essential here, especially since SaaS companies start as scrappy startups that need to make the most of their resources.
Cash burn report
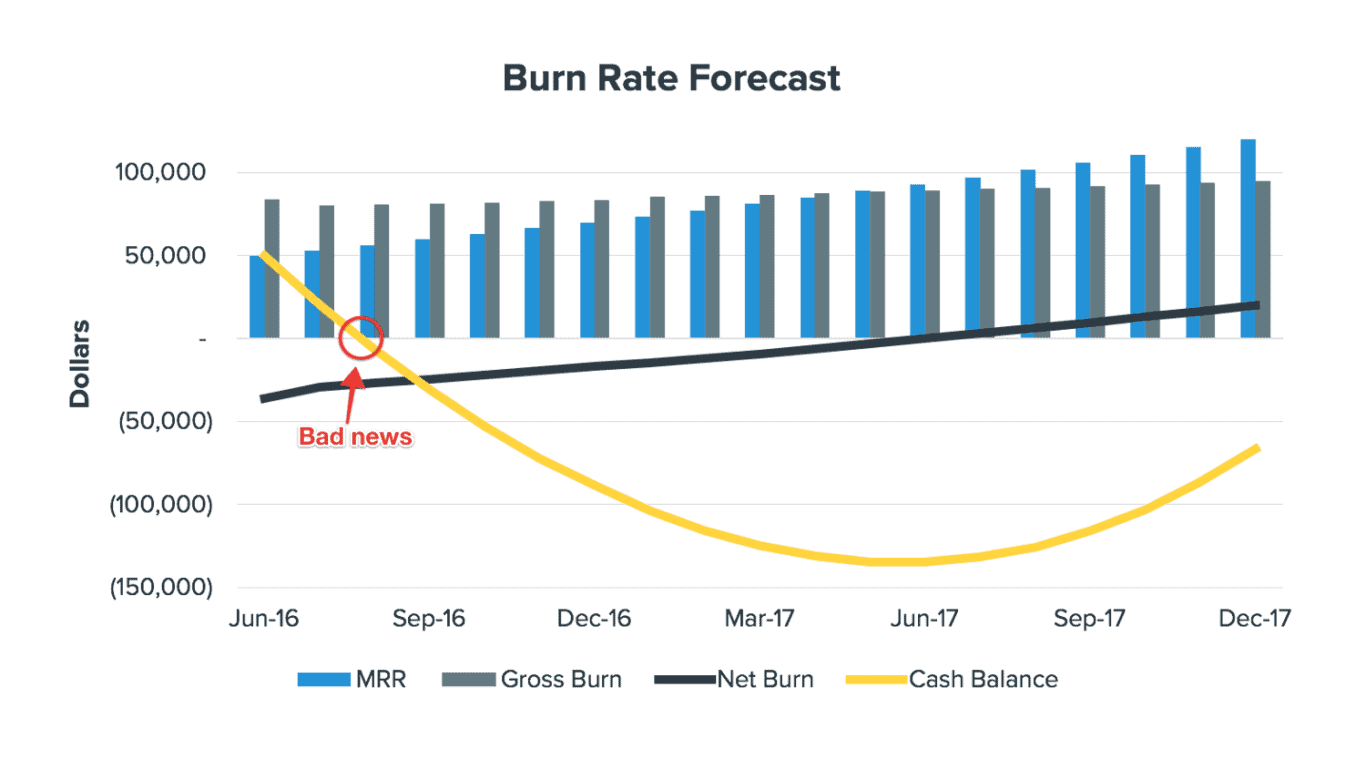
Cash burn tracks how quickly a company is using up its cash reserves over time, compared with the amount of money it’s bringing in. This metric is especially important for SaaS companies that are still early in their growth since that’s when big bets need to happen — and big bets often cost big bucks.
ARR and MRR report
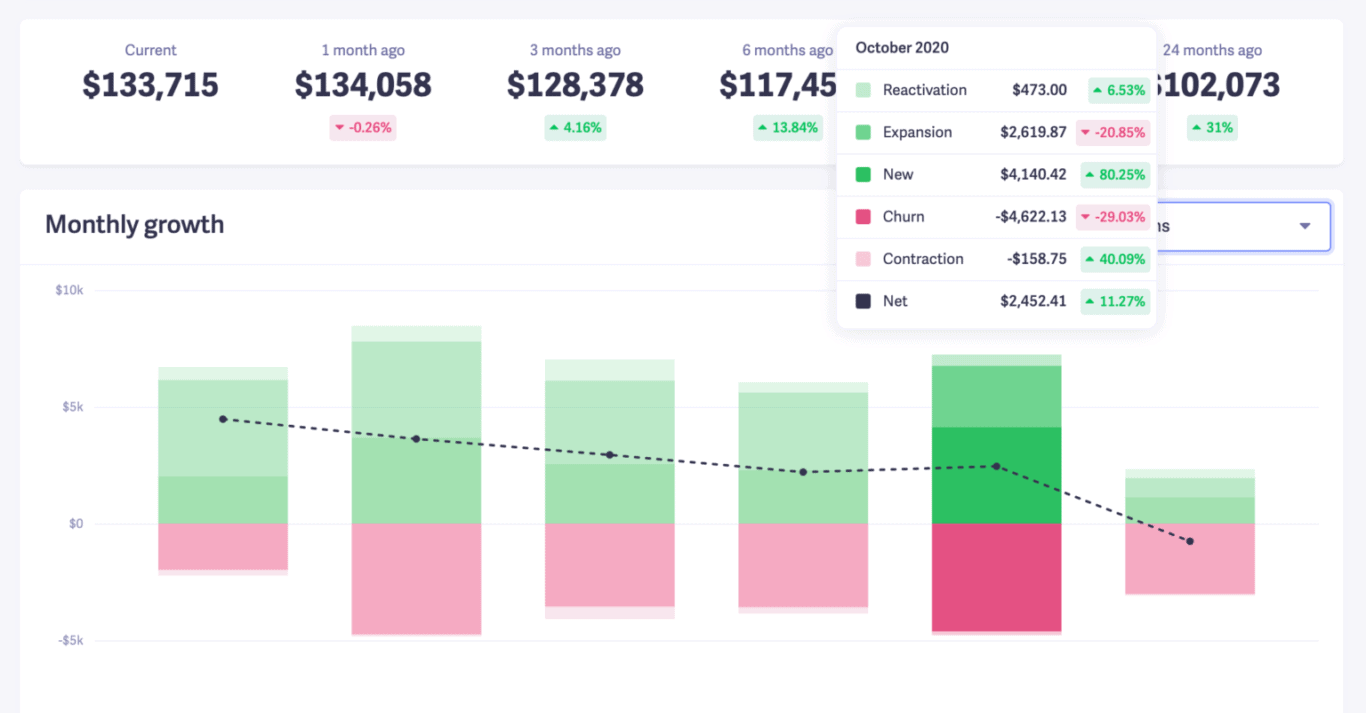
ARR and MRR stand for annual recurring revenue and monthly recurring revenue, respectively. Reports tracking this kind of revenue are common among all industries, but they’re especially important for SaaS companies because many use a subscription model that creates this sort of recurring revenue. You can automate this report pretty easily, especially if you use a dedicated tool. The screenshot above, for example, comes from Baremetrics, a dedicated subscription analytics tool.
CAC Report
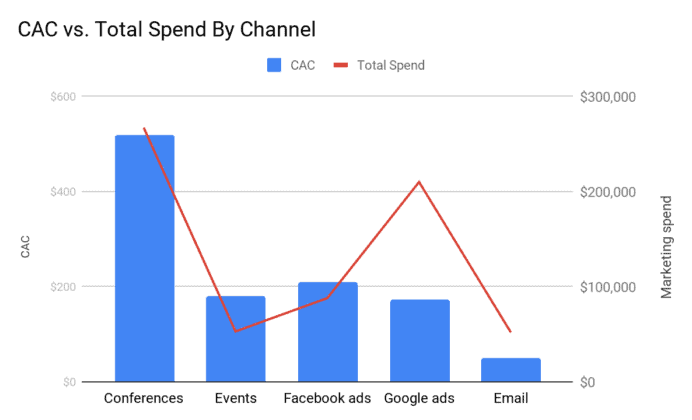
Customer acquisition cost (or CAC) is an important metric for measuring the effectiveness of marketing and sales efforts for SaaS companies. It contrasts the cost of acquiring a customer with how much money that customer generates for the business. These reports are often used by marketing and sales leaders to justify spending resources on some initiatives and descoping others.
3 tools you can use to automate reporting
It’s one thing to *want* to automate your reporting processes, it’s another to actually do it. You need the will, the right tools, and a bit of knowledge. Luckily, there are a ton of tools out there that can make this happen for your teams. Here are just a few examples of the tools you might use for this:
- Project management tools: You might not have realized that the tool you use to manage your projects even has reporting features. Many of these automatically pull data from the tasks your teams are working on, from time-tracking fields to status and priority. Have a look around your project management tool, and you might already have everything you need to start automating your reports.
- Integrations: One of the most complicated parts of reporting is getting data from multiple sources. It’s time-consuming, especially when you need to double-check everything across all platforms. But with the right integration, you can automatically sync data from multiple tools to a single place, whether that’s your project management tool or your go-to spreadsheet software. Here’s how a platform like Unito can make this happen.
- Spreadsheets: Yes, the ancient spreadsheet can still pull its weight here. Between features that automate data visualization — like pivot tables and charts — and plugins that streamline and automate your data, even a spreadsheet can help you automate your reports.
Having the right tools is essential. Otherwise, you’ll just be creating additional work for your team instead of saving them time.
4 tips for teams that want to get it right
Automating reports can save teams time, energy and money. However, it’s important to treat this like any other new process or tool: with great care. Here are some tips for automating your reports the right way.
- Start small: If you’ve only ever been manually updating spreadsheets up to this point, don’t expect that you’ll be able to completely change the game after buying the most expensive tool on the market. Start by picking a single report and see how automation can streamline it. Then, use the lessons you’ve learned to automate other reports.
- Invest in the right tools: Again, don’t just go out there and buy the most expensive tool you can find. Take some time to find the tool that fits your team’s needs rather than whatever’s most popular. Use free trials and free plans as much as you can until you find the right tool for the job.
- Iterate on your process: Don’t think of this as a “one-and-done” solution. When you first set out to automate your reporting workflows, take time to document what you’re doing. Then, if you find that the way you’ve been doing things so far isn’t working right, change it up a bit. Always push yourself to find the best way to get things done.
- Document everything: There’s a tendency, especially in smaller, fast-moving companies, to just do everything ad-hoc and hope it works out in the end. Make sure you leave a paper trail that shows what you’ve done, how you’ve done it, and how you hope to improve. Just make sure you don’t use actual paper. A word processor or a knowledge base platform will do fine.
Don’t be intimidated by this process. Anyone can automate their reporting workflows with a bit of know-how and the right tools. Just take your time, go about it the right way, and you’ll save a ton of work for yourself in the end.
Make it automated
An automated report will help your teams get information where it needs to go without putting in a ton of manual work. Whether you’re sharing the results of your latest marketing campaign, the risks of a new project, or even your website’s SEO performance, automation should be an essential part of your reporting workflows.