Unito vs. ScriptRunner for Jira: Which One Should You Use?
Jira is a powerful tool for managing development workflows, but it doesn’t always play nice with other tools. Unito and Scriptrunner are two platforms for integrating Jira. Here’s how you can find out which one’s best for you.

How to Export a Salesforce Report to Excel (2 Methods)
Salesforce reports are essential for knowing how your sales team is performing, and spreadsheets are one of the best ways to share them. Here’s how you export Salesforce to Excel.

How to Pull Data from Another Sheet (In Google Sheets and Excel)
Working with multiple spreadsheets can be tough. Here’s how you can consolidate that data, both in Google Sheets and Excel.

Task Automation 101: The What and How of Automating Work
Not everything has to be done manually anymore. Task automation is essential to ensuring that your teams spend their valuable time on the most valuable work.

The 12 Best Project Management Books to Read in 2026
The right project management book will teach you which skills you need to work on, how to run a sprint, and a whole lot more. Here are 12 of the best.

How to Create Pivot Tables in Google Sheets
Want a better way to represent your data in Google Sheets and Excel? Here’s our full guide to using pivot tables.

How to Create Simple Charts and Sparklines in Google Sheets
Charts and sparklines allow you to better represent the data in your spreadsheets and draw insights in moments. Here’s how you can build these easily.

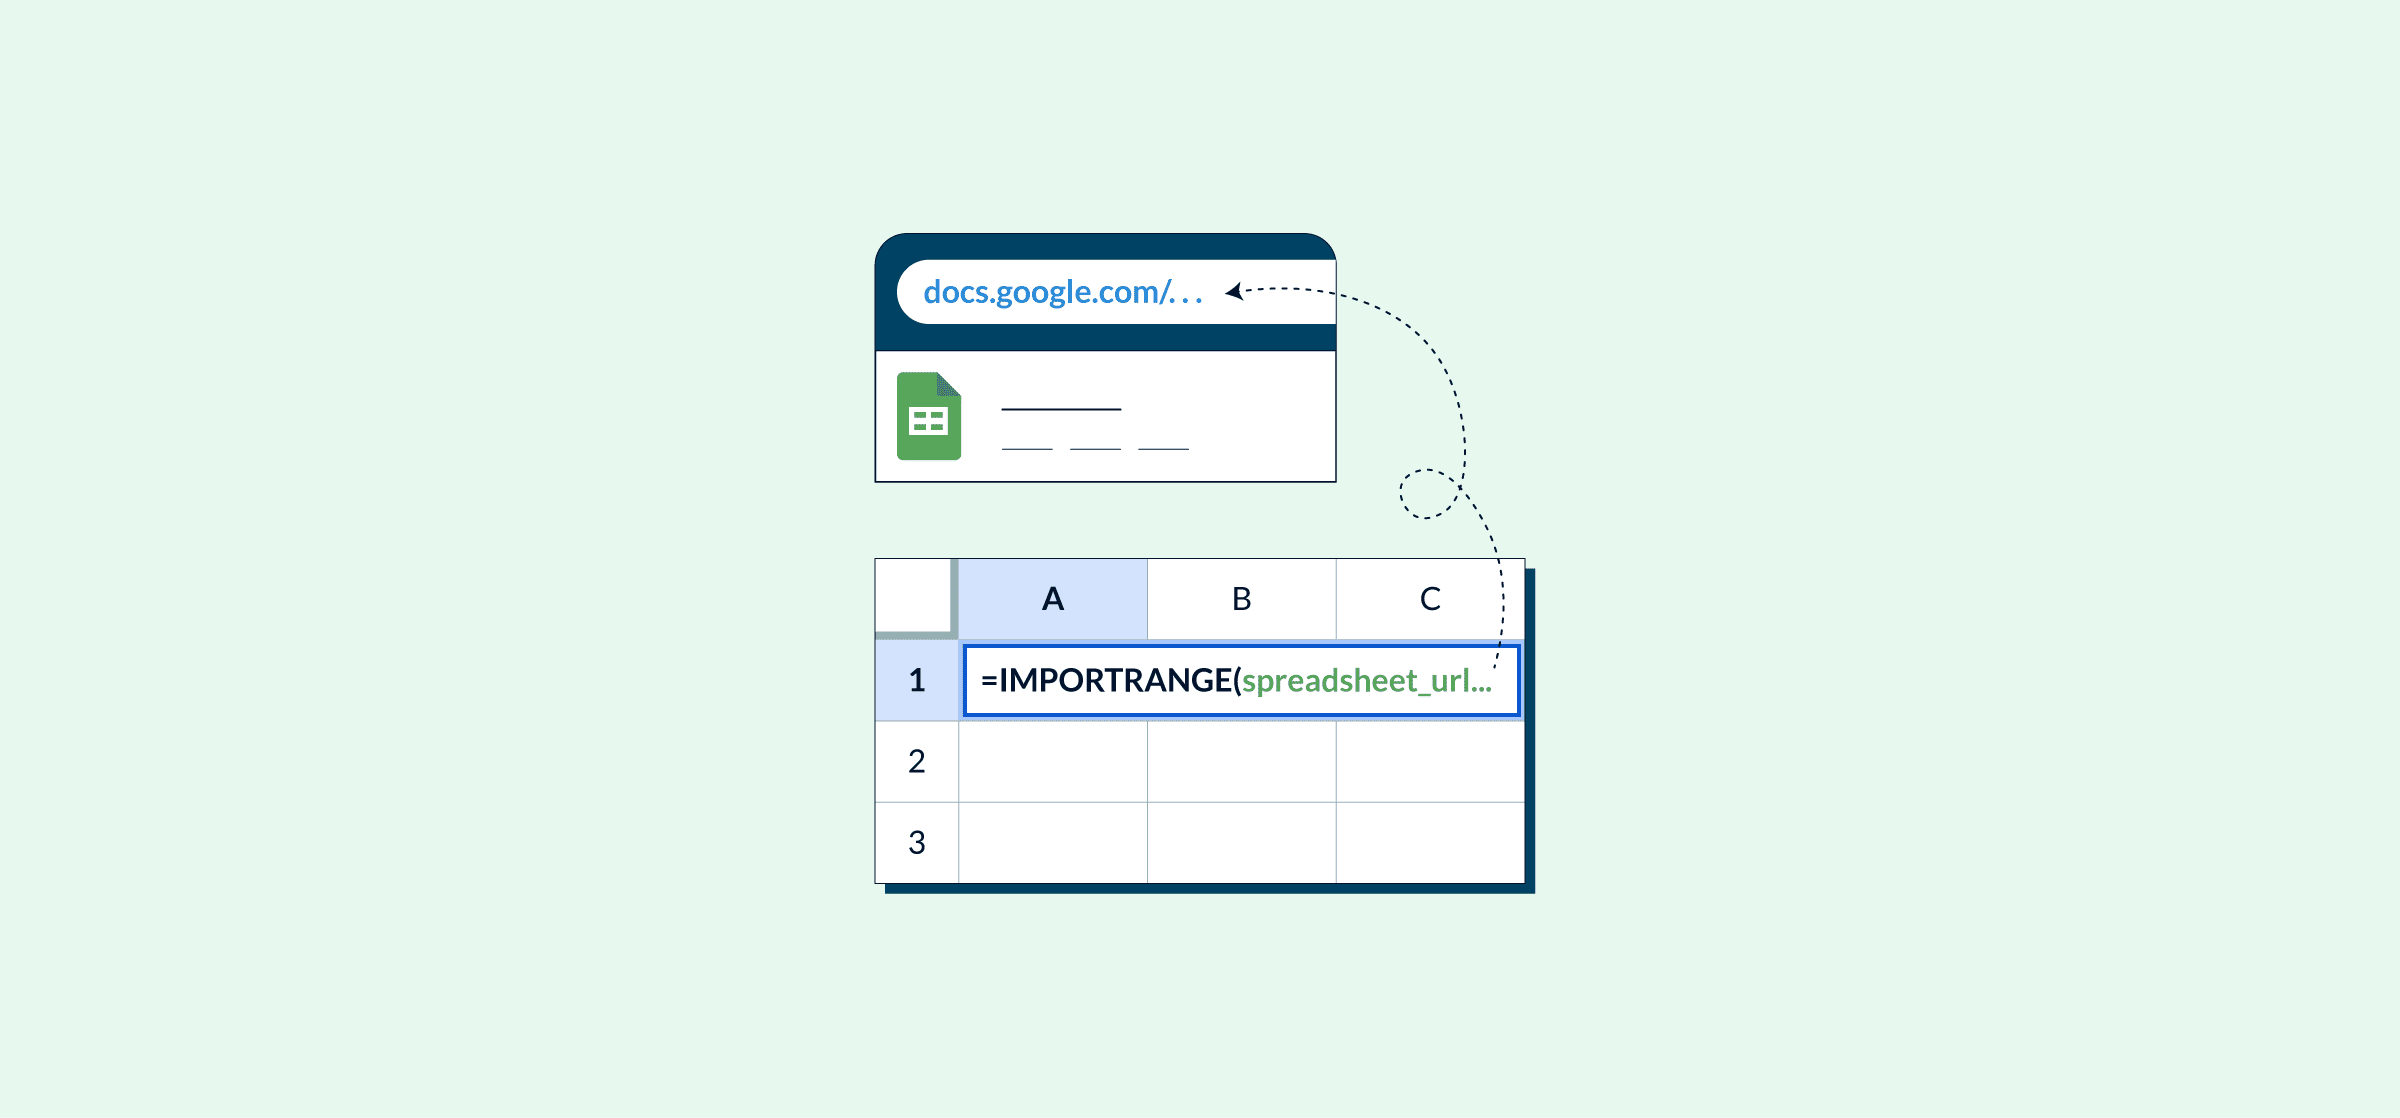
How to Use IMPORTRANGE in Google Sheets
When you have a ton of spreadsheets, you’ll need ways to consolidate your data. That’s where the IMPORTRANGE formula comes in. Here’s how.

What Is a Marketing Qualified Lead (Or MQL)?
A marketing qualified lead is a potential customer who has interacted with some of your marketing activities but hasn’t yet shown an interest in buying your product or service.

Pipedrive vs. Trello: What Tool Should You Be Using in 2026?
Pipedrive and Trello are two of the most popular tools for project management and tracking sales goals. So which one should you pick?

How to Use Conditional Formatting in Your Spreadsheets
Conditional formatting allows you to turn bland spreadsheets into powerful tools. Here’s how that works.
