How to Leverage Facebook Insight Reports for Better Customer Engagement
If your company is using Facebook to market your service or product, you’ll want to dig into the data-driven insights provided on the platform via the Facebook Insights tab. Why take the time? To determine whether the work you’re doing is actually working — or not.
All data is good data in a way, as it either confirms that your efforts are on the right track or allows you to shift toward tactics that result in better customer engagement. The analytics gleaned from Facebook Insights are your very own yellow brick road to continuously optimizing your social media and advertising strategy.
Below, you’ll learn the most important metrics for you to be tracking using Facebook Insights and how you can master creating a Facebook Insights Report on your own.
Ok now, let’s get data-driven.
What is a Facebook Insights Report?
A Facebook Insights Report is a visual analysis of the Facebook metrics you want to look at, exported from the intuitive, integrated Insights page. It includes the data type (page data, post data or video data), the file format you prefer, the date range and the layout.
We’ll get more into how you can do this later, but for now — let’s talk metrics.
Which metrics you should track
There’s a ton of data provided in Facebook’s Insights section, and it can become overwhelming if you’re looking at it all at once. Let’s run through some of the metrics that are the most important to be tracking on the daily, and for different types of situations.
General metrics to keep track of on the regular
If you want a glimpse into your general performance, these are three core metrics to keep your eye on to keep a pulse on the overall health of your Facebook page.
Engagement
This metric is all about action and how your content resonates with people based on how they interact with it. Think link clicks, shares, comments, reactions, and more.
Total reach
People often confuse reach and impressions, but they’re not the same and should both be tracked for different reasons. Reach refers to how many unique sets of eyes have seen your content.
Total impressions
Impressions refer to how many times a post shows up in someone’s timeline. So not how many different people have seen it, but how many times it has been seen.
There’s your trifecta: Engagement, reach, and impressions. However, there are plenty of other metrics to dig into.
Metrics to track if you’re running an experiment
In this instance, you’ll want to compare certain metrics before and after a certain period to see if the test you’re running has worked. You should take a look at:
- Total impressions of posts
- Total organic views
Metrics to follow to better understand your audience
It’s important to not only get a handle on the type of content you’re posting, but who is looking at it and if it’s the audience you intended to target. Try tracking some of these metrics:
- Reach by city
- Reach demographics
Likes by language - Likes by gender
Metrics that shed light on your page’s video performance
Keeping a steady focus on your video metrics will allow you to optimize things like your posting cadence, video length, quality, and more. Consider tracking these metrics:
- Total video views
- Unique video views
- Organic number of seconds viewed
- Paid number of seconds viewed
- Video repeats
Metrics that let you see the next step users took
While social media is typically a very top-of-the-funnel channel used for brand awareness and sharing knowledge, it’s beneficial to monitor what people do after they spend some time on your platform. Here are some metrics you can look into to grasp if you’re moving them down the funnel or simply if they’re interested in your brand.
- Total phone calls click count per page
- Total website click count per page
- Total get directions click count per page
4 Steps for Creating a Facebook Insights Report
Now that you know what metrics to track, here’s how you convert them into a visually digestible and actionable insights report.
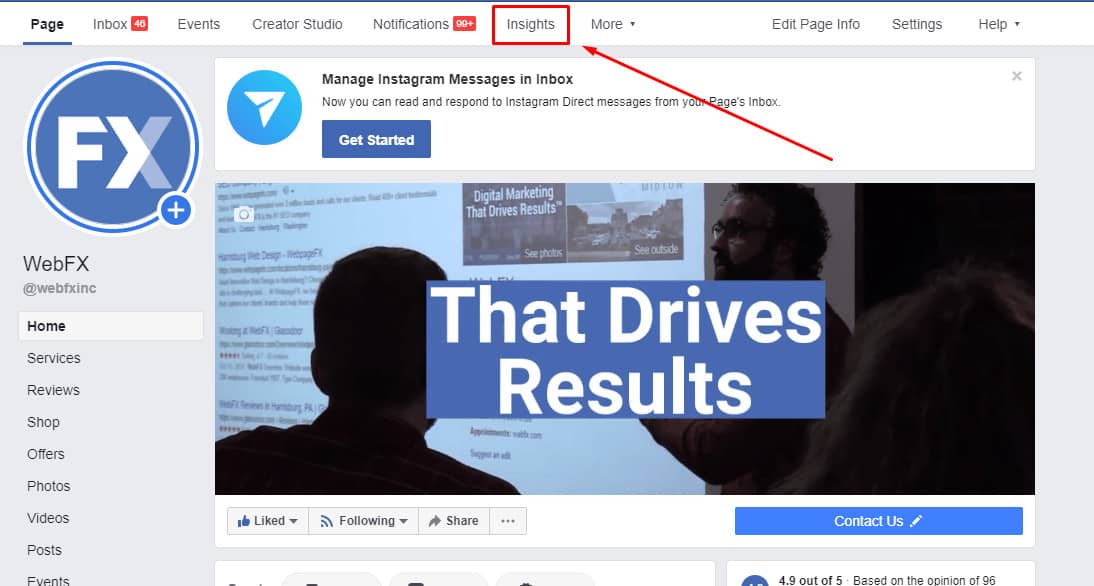
Step 1: Locate your page’s Insights section
Once you’re logged into your company’s Facebook page, click on “Insights” — it’s embedded in the top navigational toolbar.
Step 2: Determine the period you’d like to see data for
You’ll find yourself on a page overview where you can now select the date range you’d like to see. For example, if you were running a month-long campaign, you might choose 28 days to best capture the campaign data. If you’re tasked with putting a weekly performance report together, select the last 7 days. It all depends on what you want to look at
Step 3: Export your Facebook Insights Analytics report
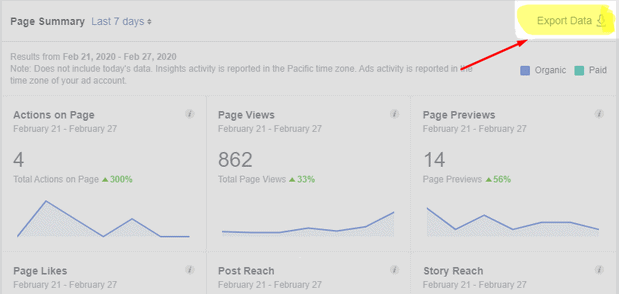
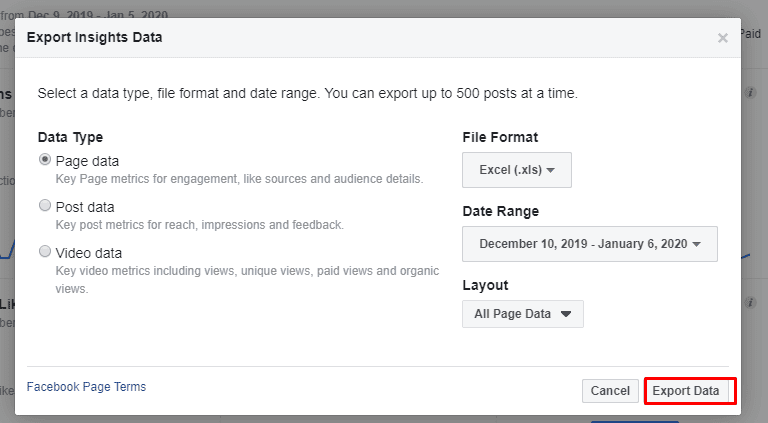
This simple step consists of clicking on “Export Data, located on the top right of the page. Facebook will then prompt you with which type of data you want to export, for example:
- Facebook page data, demonstrating your page’s overall engagement.
- Post data on metrics like reach, impressions, and feedback.
- Video data analytics like views, unique views, as well as organic and paid views.
Subsequently, you’ll determine your file format (Excel, for example) and the layout. Then you’re ready to hit Export Data!
Step 4: Analyze the data
While collecting the data is one step in the right direction of understanding your page and post performance, it’s putting action to the insights that really make the data meaningful. To make effective adjustments to your strategy based on the analytics provided, you’ll need to take time to really interpret the data. Think: what do the numbers reveal?
Final Thoughts on Facebook Insights Reports
Not taking the time to look at your Facebook Insights Reports is like playing a sports match without a coach. You need to call a huddle every so often in order to reflect on your tactics and adjust your strategy to win.
Watch Unito’s Facebook Ads Manager integration in action
Unito’s integration with Facebook Ads Manager offers a powerful tool for streamlining your marketing reporting processes to give you more time for optimizing insights and fine-tuning your reports.