
The Sales Leaderboard: What It Is and How to Make Your Own
Keeping a sales team motivated can be one of the toughest parts of being a sales leader. Whether they’re high-performers or not, people need to know that their hard work is contributing to a larger goal, and telling them in an occasional 1 on 1 isn’t going to do it. That’s where the sales leaderboard comes in.
Find out what a sales leaderboard is, get tips for creating your own, and learn about some sales tools that have them already built in.
What is a sales leaderboard?
A sales leaderboard is a visual representation of your sales team’s performance. By using sales KPIs — or key performance indicators — you can capture how much new business your sales team is bringing in. And then, with those figures on your leaderboard, you can show off who’s ahead of the pack. Some organizations choose to make these leaderboards public and highly visible to their sales team, while others only use them for performance reviews and other internal processes.
The exact stats you use on your leaderboard can vary, but usually, you’ll want to focus on revenue-generating metrics and the activities that build up that revenue — like sales calls and deals owned.
Should you share your sales leaderboard with the team?
That depends entirely on the kind of culture you want to promote in your sales team. Do you want a super-competitive team that’s constantly trying to get ahead? This could be the right culture for some businesses, while others might shy away from that kind of pressure. Talking with your sales team is one of the best ways to determine if this is a culture fit for your business.
A few benefits of the sales leaderboard
So why put in the work? After all, you can show off your sales metrics with regular reporting, and you can review sales goals in 1 on 1 meetings. But a sales leaderboard has a few benefits you won’t find anywhere else.
- It’s inherently motivating: Most salespeople have a competitive side, and a leaderboard is a great way to bring it out in them. High-performers will push themselves even harder and people who aren’t performing as well will actively seek out support to sell more.
- It reminds the team what they’re working towards: Individual contributors can often feel disconnected from broader business goals. But with a sales leaderboard that’s constantly ticking upwards with every new deal, your team will have a constant reminder of how their work contributes to the organization.
- It brings people together: Strange, considering the competition angle, right? But by encouraging the team to celebrate big wins on the leaderboard — no matter who it’s from — you can help build a balanced culture where competition doesn’t come at the cost of collaboration.
Tips for creating an effective sales leaderboard
While a sales leaderboard is a great way to keep your team motivated — and evaluate their performance — it’s all too easy to miss the mark. Here are some times to ensure that your sales leaderboard actually works as intended.
Keep it simple
A leaderboard has to be quick and easy to read from a distance. If your leaderboard tracks a dozen metrics for a sales team of 20, it won’t be very useful to anyone. While it’s tempting to squeeze in as much data as possible, you’re better off limiting yourself to crucial data points. Keep your leaderboard simple and it’ll be a lot more useful.
Make it easy to update
Maybe you want to have the best leaderboard out there, with 10 data sources, detailed statistics, and real-time updates. But guess what? If it’s too complicated to update, it will constantly be out-of-date. Business intelligence software and other complex solutions are great, but if you’re responsible for keeping your leaderboard up to date you’ll have to learn how they work. If you have better things to do, you might need to scale back your expectations.
Use visual cues
Know what’ll instantly make your leaderboard easier to read? The right visual cues. Whether that’s bright colors — like red when your team is under its quota — or other design elements, you want to use these visual tricks to bring attention to the right place. By working with a designer, you can get an idea of what these cues should be.
Go easy on the charts
Everyone loves a good chart, but it’s definitely possible to have too much of a good thing. By all means, add a few charts to your leaderboard; they’ll be great for representing important data visually. But make sure you don’t go overboard. If the actual people on your leaderboard are getting dwarfed by charts, you’ll know you’ve gone too far.
3 sales tools with built-in sales leaderboards
While there are ways you can build your own leaderboards, the sales tools you’re already using might be able to do the heavy lifting for you! Here are some sales tools that already have built-in leaderboards you can roll out right now.
Salesforce
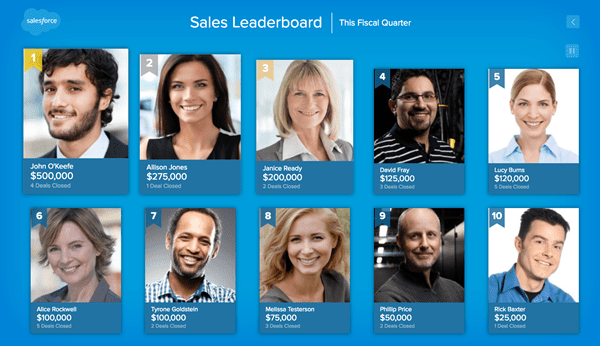
Salesforce is easily one of the most popular sales tools out there, especially for larger businesses. You’ll find the Sales Leaderboard in the Salesforce Command Center, and you’ll be able to show up to 10 of your salespeople on it.
Zoho CRM
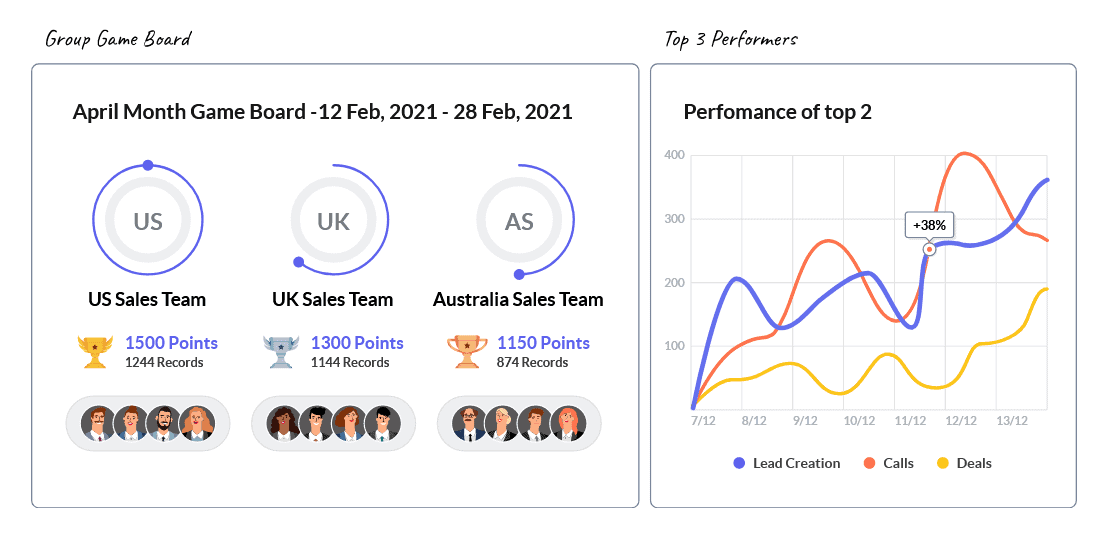
Zoho CRM is a popular option for customer-facing teams around the world, and it also lets you build a sales leaderboard through Zoho Motivator. That’s not all you can do with it though; you can also build all sorts of dashboards.
Apptivo
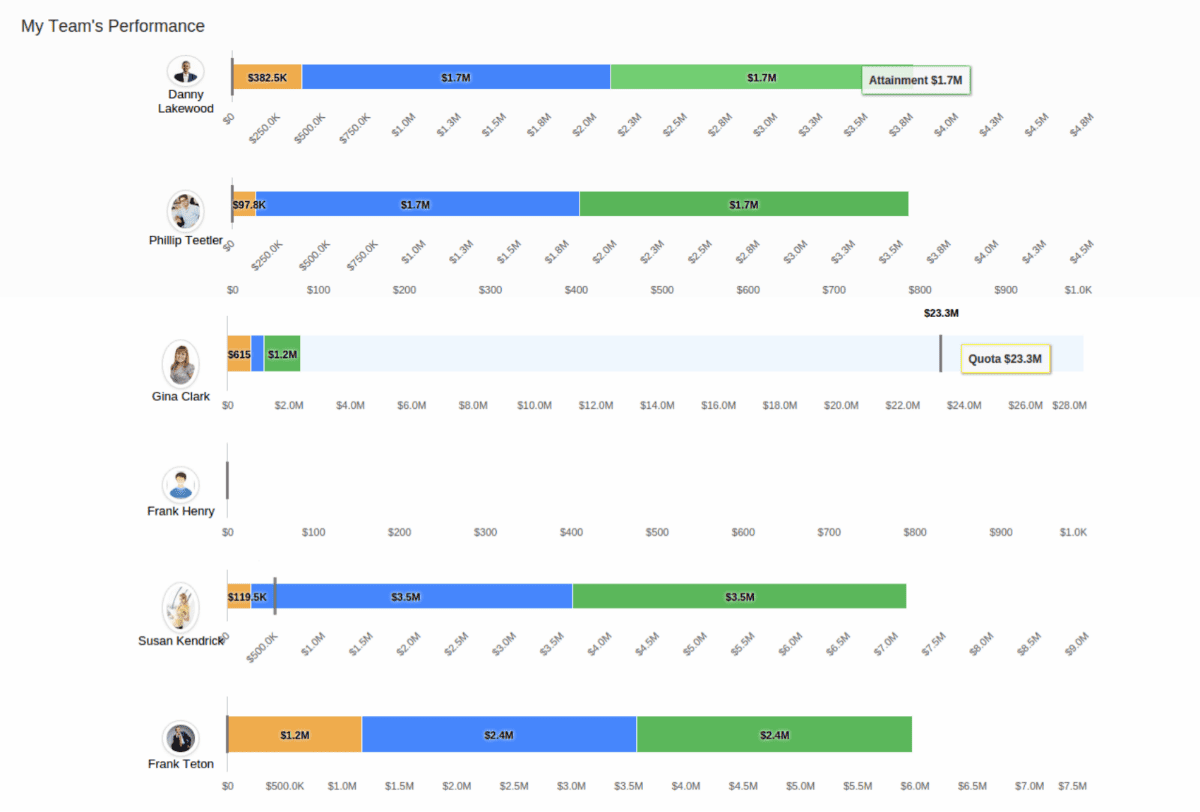
Aptivo is another sales tool with a built-in sales leaderboard, though it’s hidden among its numerous other dashboards. Called “My Team’s Performance,” this dashboard doesn’t have the same flexibility as what you’d find in other tools, but it’ll save you the work of building your own.
Lead the way
A sales leaderboard can bring out your team’s competitive side, help push high-performers to new heights, and let leaders know who needs extra support. Just remember to keep your leaderboard as simple as possible, go easy on the charts, and use a strong design to make it easier to read. Whether you show it on the sales floor or not, a leaderboard will transform the way your team sells.