
Google Ads Reporting: The Trick for Better Marketing ROI
Google Ads allows you to quickly ramp up your marketing strategy. By selecting the right keywords and developing targeted messaging, you can find your audience online and encourage them to come to your website, fill out a form, or even make a purchase.
But tracking your analytics is extremely important. A campaign that isn’t optimized can lead to a lot of clicks, but no conversions. Or you might receive several impressions, but no one is taking any action. All of these could indicate that your campaign isn’t doing well.
For this, you need accurate reports that measure the right metrics.
In this article:
- The importance of accurate reporting
- How to connect Google Ads with Google Analytics
- Tracking the right metrics
- How to set up custom Google Ads Reports in Google Analytics 4
- Get the best of both Google Ads and GA4 with Unito
The importance of accurate reporting
Proper reporting on analytics is the foundation of every good campaign. While the stats in Google Ads will provide you with some important insights, they don’t always tell the whole story. You need to know if those clicks are translating into sales or even qualified leads. If not, then you need to reevaluate your efforts and potentially pivot to a new strategy.
If you’re not getting quality data, your return on ad spend (ROAS) and overall return on investment (ROI) could be affected – and your stakeholders, clients, or even coworkers might not be happy with your performance.
How to connect Google Ads with Google Analytics
Automated reporting tends to provide more accurate data while saving everyone time and energy. By connecting Google Ads with Google Analytics, you can track everything from clicks to add to carts and sales from start to finish.
If you haven’t connected Google Ads and Google Analytics, follow the below steps.
- Sign into Google Analytics.
- Navigate to the Admin tab and select your property.
- Click on Google Ads Linking.
- Click + New link group.
- Pick the right Google Ads account.
- Click continue.
- Add a group title and turn on linking.
- Ensure that auto-tagging is enabled.
- Select Link accounts.
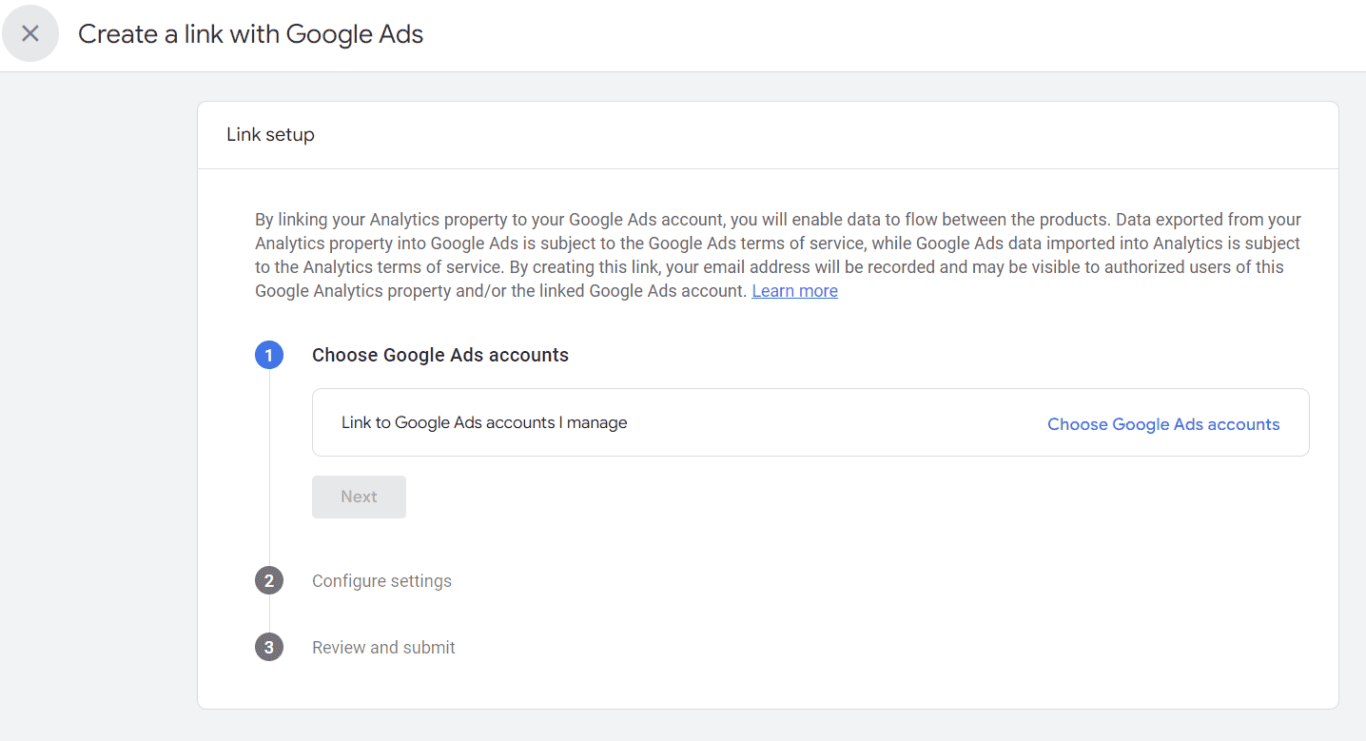
Once connected, Google Ads data will routinely flow into Google Analytics 4.
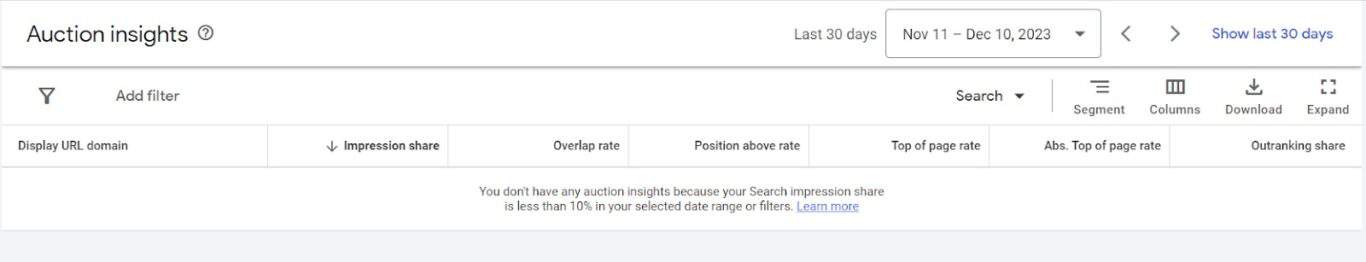
While there are some reports you can view in Google Ads, they’re mostly designed to provide you with high-level insights. For example, the Auction Insights report lets you see how you stack up against competitors who are bidding in the same space. Depending on how much search impression you have, you may or may not see data here. A lack of data shows that you need to increase spend, improve your ad, or improve your landing page quality score.
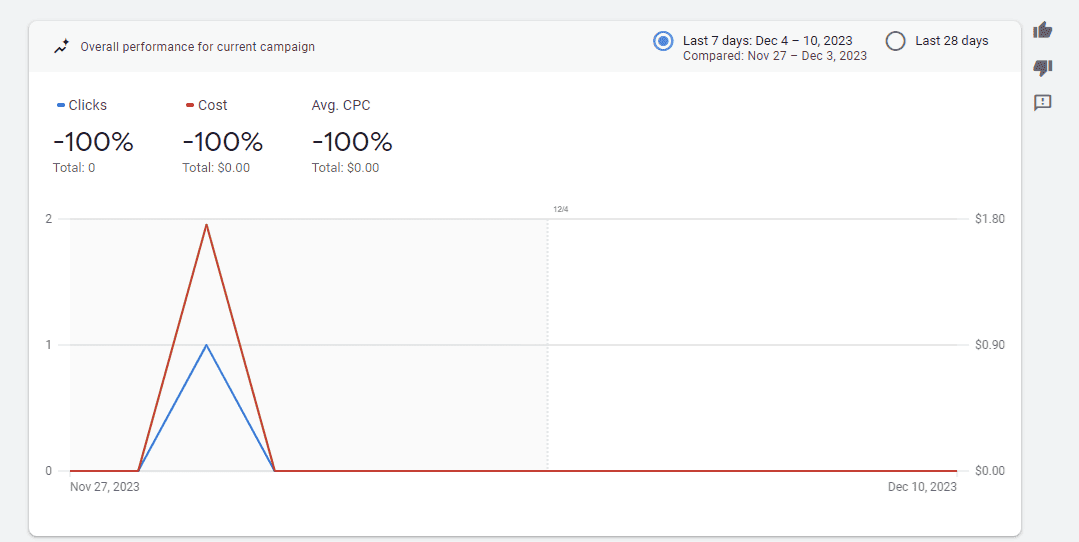
There’s also the Insights tab, which provides you with an overview of how your campaigns are doing. These could include which keywords are trending for your campaign, overall performance, and top audience segments.
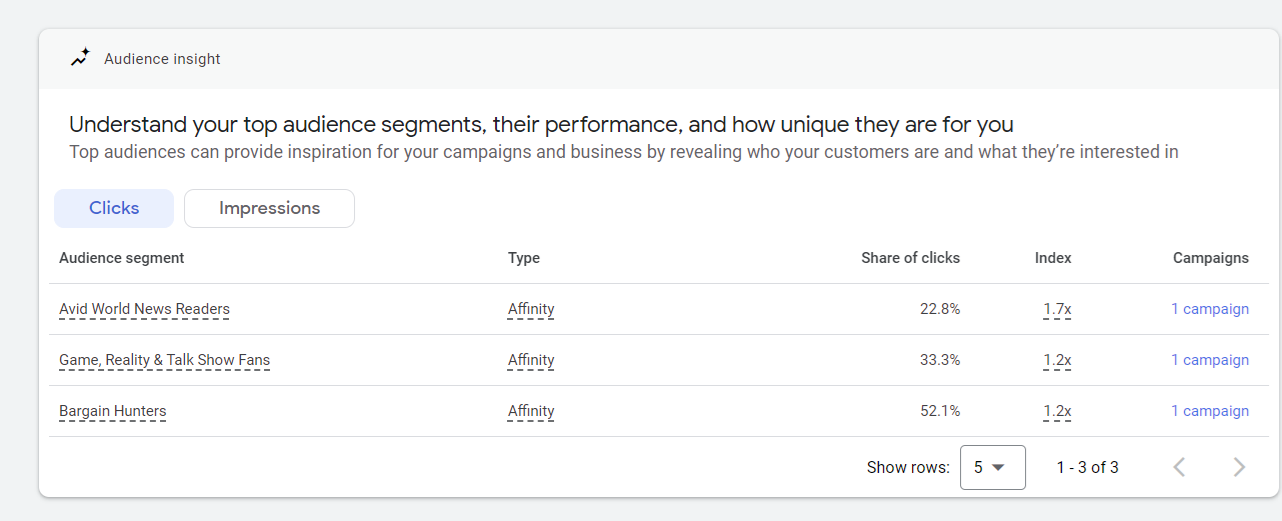
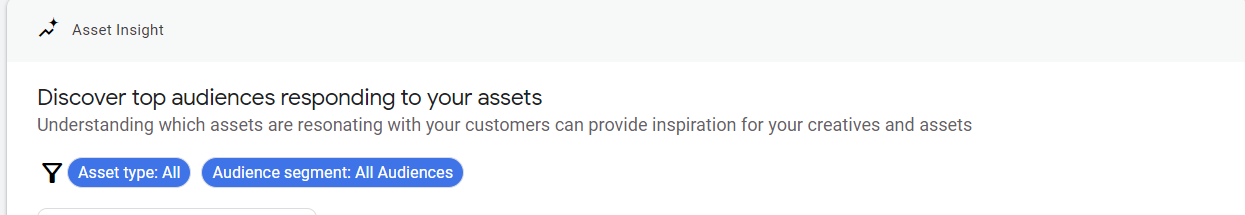
You’ll also get breakdowns of your best-performing assets like sitelinks, images, text, and videos.
These reports help provide you with quick insights into what’s working and what’s not working in your campaigns. For example, you may find that one type of asset is working and you’ll choose to add it to all your campaigns or create ones similar to it. Or if one audience segment is working better than another, you might want to turn off the other one if it’s wasting budget.
While the Google Ads data is good for quick gut checks and pivots, they don’t provide in-depth data. You need to see the full picture of your marketing efforts. This is why tracking your Google ads results in Google Analytics 4 can be so beneficial.
Tracking the right metrics in Google Ads
Now, that you’ve got Google Analytics 4 and Google Ads connected, it’s time to start tracking your important metrics. But which ones should you focus on?

The obvious metrics are:
- Clicks: Clicks are the number of people clicking on your ad. These can affect your budget. If the cost per click (CPC) is high, then you might not get as many clicks if your budget is lower. You also need to consider the quality of those clicks. Are you getting good traffic from your clicks? Is the traffic engaged on your site? If not, then you might want to review your keywords and pause any terms driving unnecessary traffic.
- Click-through rate (CTR): The CTR is the number of clicks you get in relation to your views/impressions. It’s a ratio that helps you determine whether potential visitors are clicking on your ad. If your CTR is low, then this could be a problem with ad position, messaging, or even imagery.
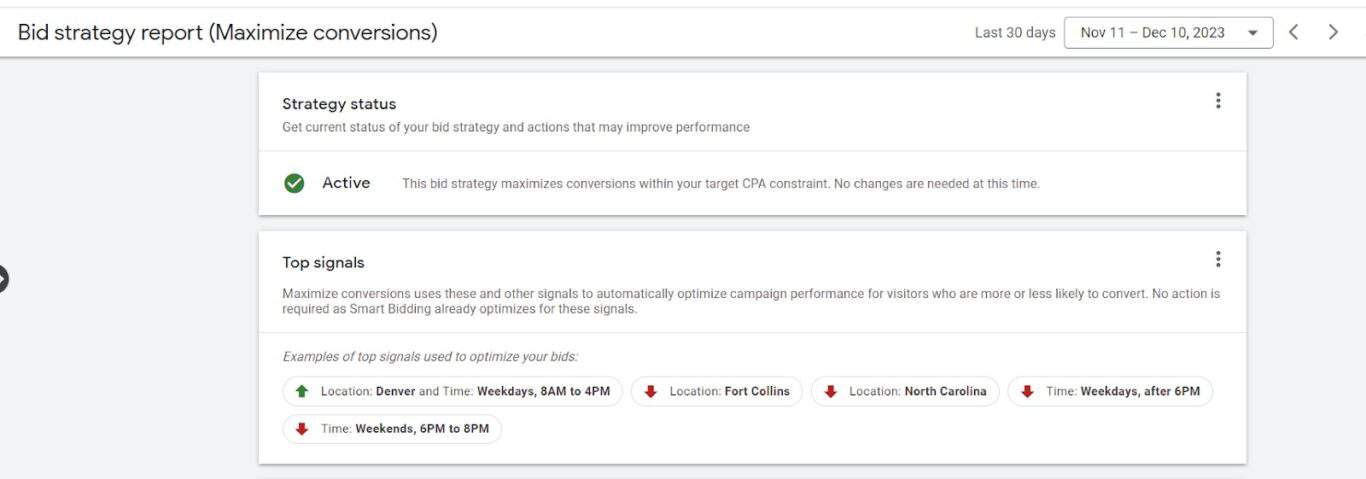
- Conversions: A conversion is any action that you want someone to take. It could be a sale, a form fill, PDF download, event, or even page visit. Deciding what conversions you want to track before you launch your marketing efforts is important. This will inform your return on your advertising spend. It also allows you to set up Maximize Conversions campaigns. Google will use your conversion data to create smarter, machine-learning campaigns that are set up to drive more conversions.
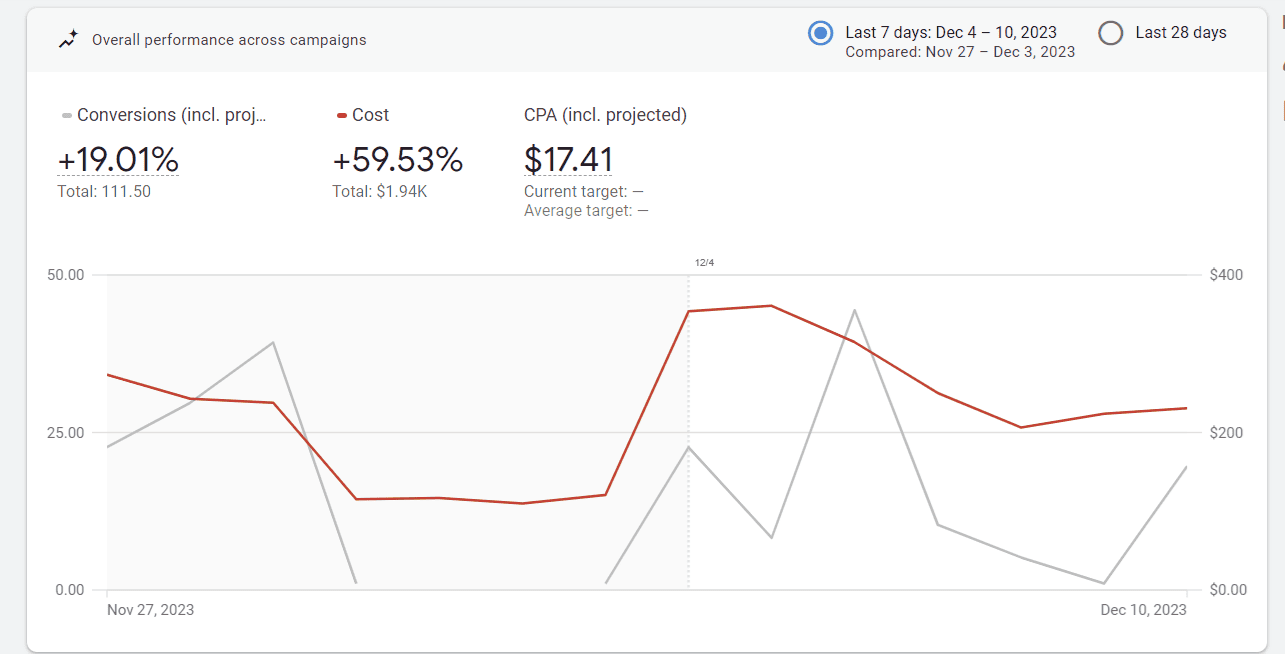
If you want to check on your bid strategy stats, click on Bid Strategy in the Campaign overview report, and you’ll pull up a report like the one below. You’ll be able to see your performance history, top signals, and more.
- Conversion Rate: This is the number of conversions in comparison to the number of clicks. This ratio is pretty important. If you’re getting a lot of clicks, but a low number of conversions, it’s time to audit your campaign. Look for low-performing ads, keywords, and ad groups. Review your top audiences and see if they’re the right ones. Look at the search terms people are using to find your ad. Tweaking all these – or even turning off poor-performing ads, campaigns, or ad groups – can help create a more effective campaign.
- Quality Score: The purpose of the quality score is to help you see how well your ad quality stacks up against competitors. A lower quality score can lead to lower ad position, whether your ad even shows up or not, and how much you pay per click. Quality score is calculated based on how relevant your ad or landing page is to your keywords.
- Return on Ad Spend (ROAs): ROAS helps you determine whether your campaigns are performing well. It shows whether your ad spend is resulting in revenue. If you’re spending more than you’re making, then you’re going to have a negative ROAS. You want every dollar that your campaigns consume to lead to a positive return.
If you’re driving towards sales, then another one to add is total conversion value. Total conversion value is affected by both the number of conversions and the average order value. Depending on the item or number of items in the basket, your total conversion value can increase or decrease. So, what does this mean?
Think of it this way, if you’re spending $1,000 per month, but most of your high-ticket items aren’t moving, you might only be selling $500 per month. Now you have a negative ROI. In that case, you might want to pivot your bid strategy to Target (ROAS) or something similar to improve your campaigns. Note that in the new Google Ads experience, you’ll see Total conversion value abbreviated as Conv. value.
How to set up custom Google Ads reports in Google Analytics 4
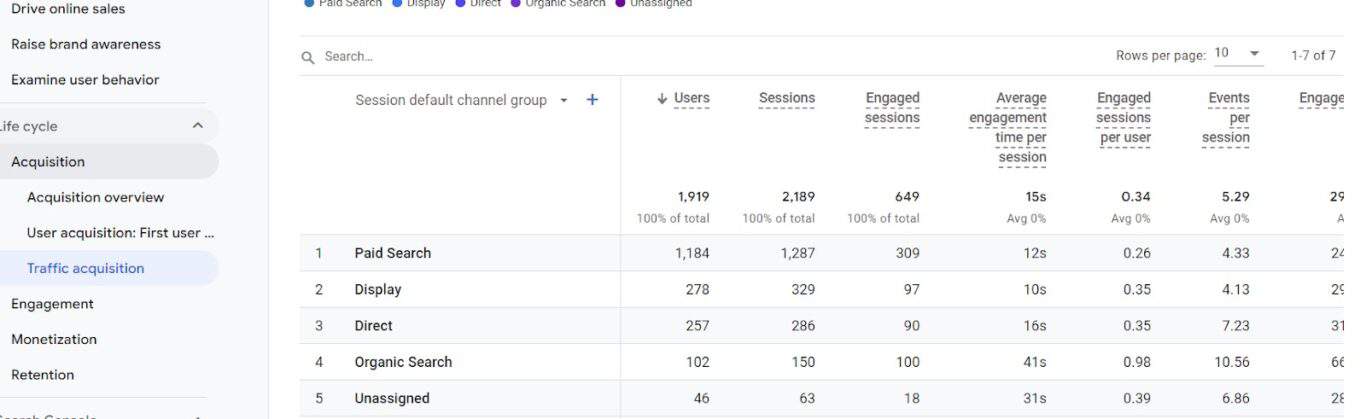
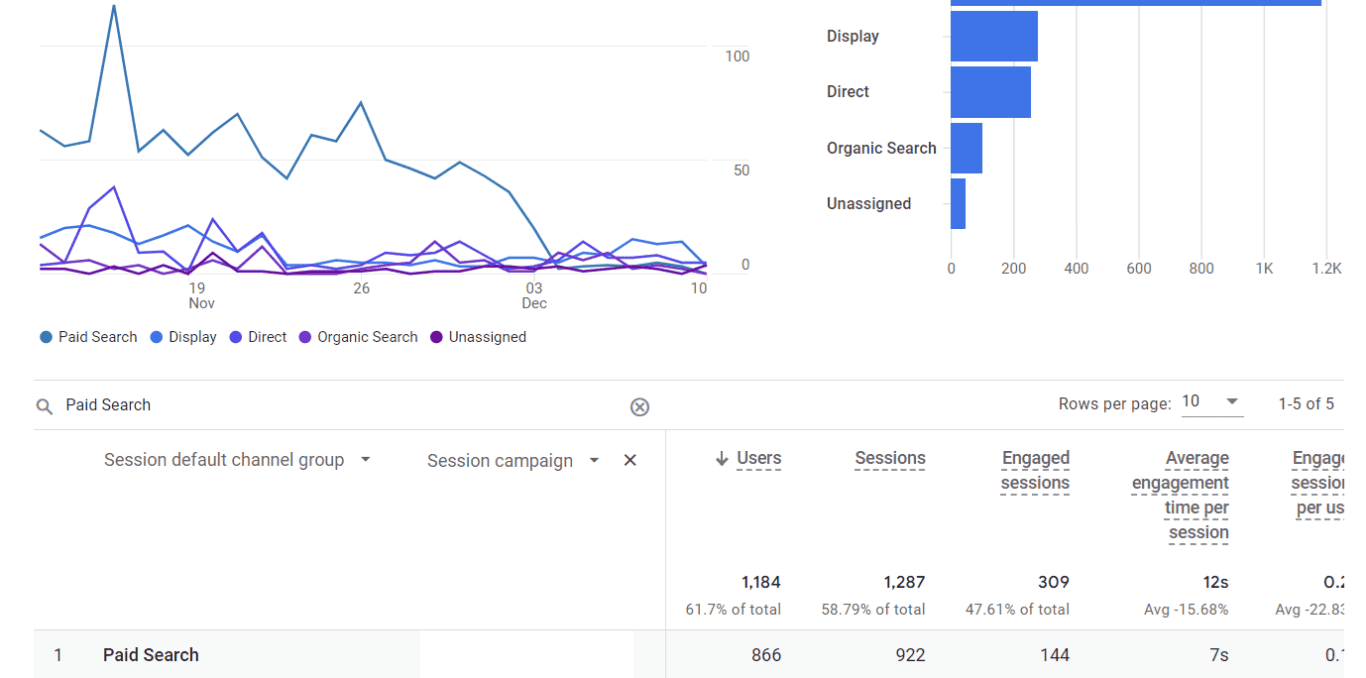
If you’ve connected Google Ads and Google Analytics, setting up Google Ads reports is straightforward. In the default reports, you can already see the Paid Seach traffic in the Traffic Acquisition report.
But you can also set up a custom report that solely focuses on Google Ads.
To do this, follow these steps. Go to the Library, select +Create new report, and select Create detail report. If you’d like a step-by-step process for creating Google Analytics 4 reports, we have a guide for you!
Select the Traffic Acquisition report. Here, you can search for Paid Search. This will bring up all your paid search campaigns. You can then add Session campaign, and you’ll see all the campaigns broken out.
Be sure to save your new report. You can also add it to the main dashboard by adding it to a Collection.
If you have a shopping cart, you can create an e-commerce purchases report instead. You can sort by Session campaign to see which purchases were related to your specific campaigns.

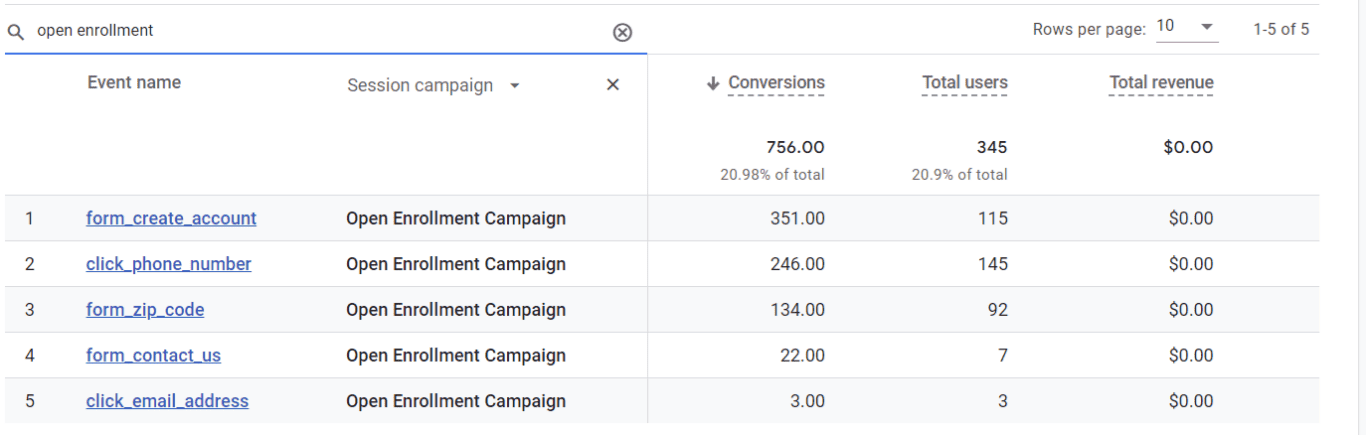
If you want to see conversions broken out by paid search campaigns, you can also create a Conversion report and solely focus on specific campaigns. You could save individual detail reports by specific campaigns or groups of campaigns. For example, if you’re running a spring campaign on different paid search platforms, you could focus only on these. Just be sure that the title of your campaigns across the platforms are the same. (For this example, add “spring” to all campaigns.)
Get the best of both Google Ads and GA4 with Unito
Unito connectors work with Google Ads and Google Analytics to create quality, automated reporting that provides you with insightful, actionable data. Once set up, the connector will constantly feed new data into your spreadsheet. You simply have to do the analysis.
Data will always be accurate, and no member of your team will have to spend hours pulling it. Get ready to make your Google Ads reporting easier than ever!
Here’s how to connect Google Ads with Unito
Follow our step-by-step guide to syncing Google Ads and Google Sheets or watch below:
Watch our GA4 integration sync with Google Sheets
The video below outlines this process or you can read our walkthrough for GA4 here.