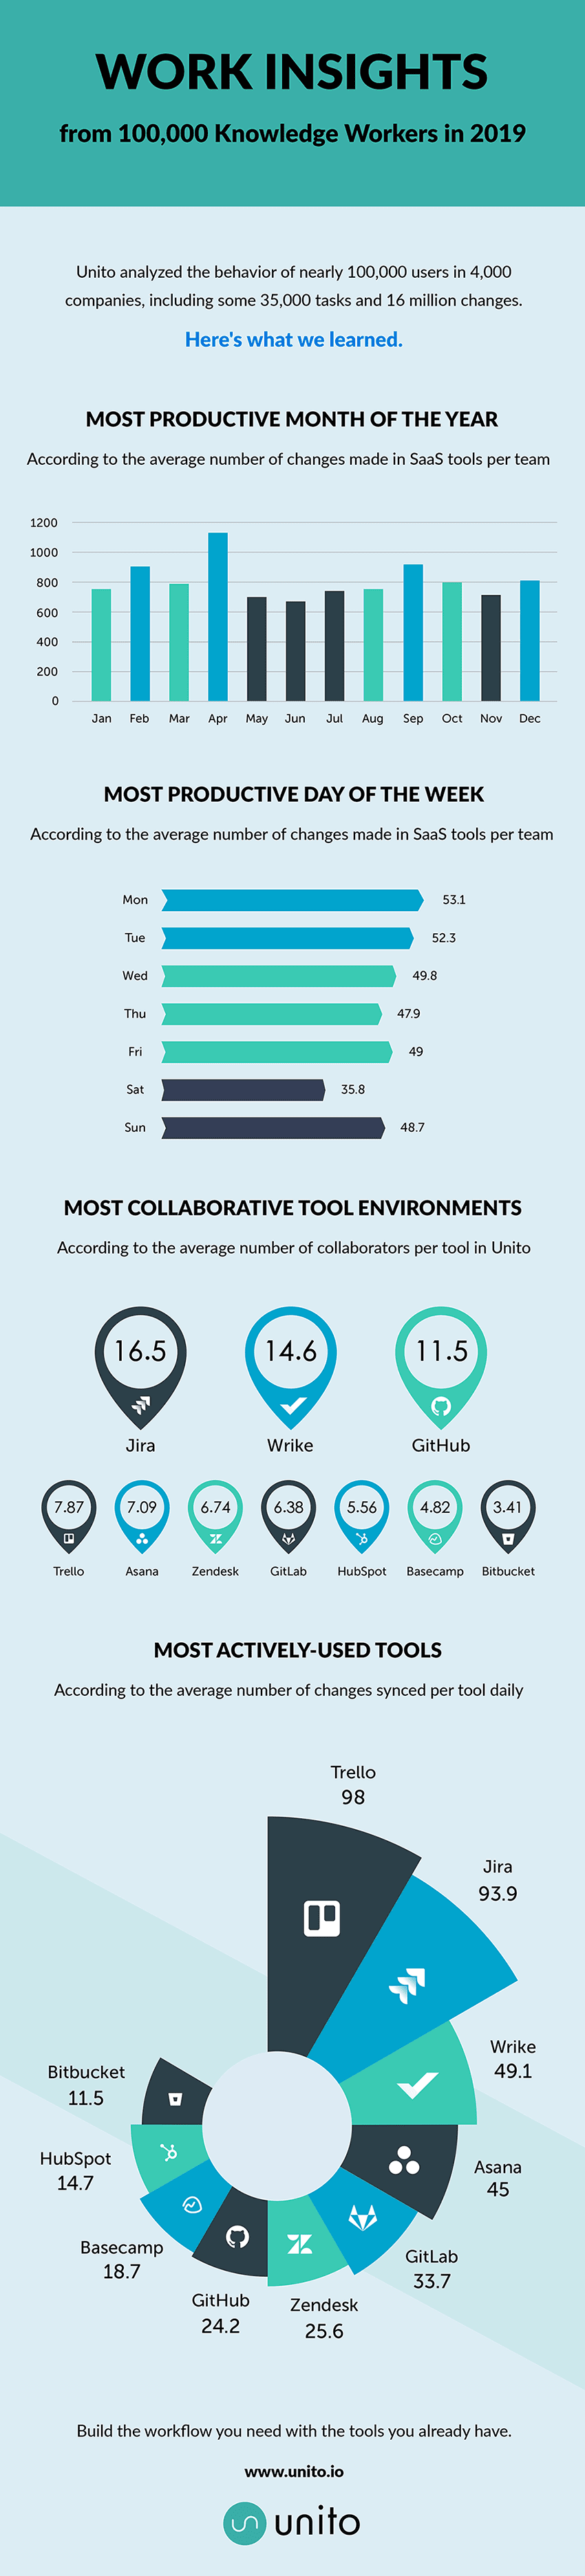
We Analyzed the Behavior of 100,000 Unito Users. Here’s What We Learned.
Digital tools have become a crucial part of our workdays. We spend so much of our time in Trello cards, Asana tasks, or Jira issues that it’s hard to imagine working without them. That sort of reliance turns these work management tools into a fantastic source for insights about work habits.
Unito acts as a middleware between many of these tools, building connections between them that people use to manage complex projects and collaborate. While we don’t track the content or data that people are syncing with Unito (we take security very, very seriously), we’re still uniquely positioned to see how people are working in these tools. We took a look at the behavior of nearly 100,000 users in 4,000 companies, including some 35,000 tasks and 16 million (yes, million!) changes, and identified some interesting data points and trends.
Just a note: these conclusions reflect the behavior of Unito users and may not reflect all digital workers. Treat this as an interesting snapshot into one group of tech-savvy professionals.
Want the full infographic? You can find it at the bottom of this post.
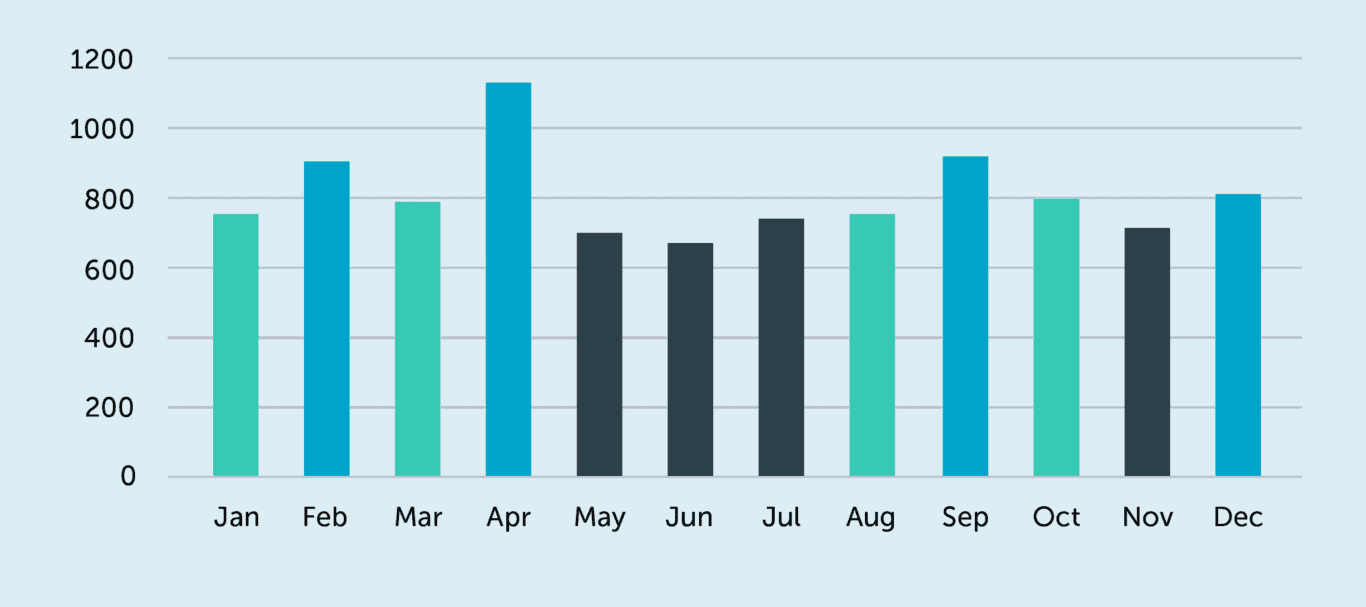
February, April, and September are the most productive months
The purpose of Unito is to build two-way connections between work management tools, making it easier to collaborate. While we don’t track what our users are sharing and updating between tools, we can see how many changes each team is making.
By looking at the number of synced changes, we were able to determine that April, February, and September are when things get done.
January is often thought to be an extremely productive month — New Year’s resolutions and the like — but it’s got nothing on February. Despite being the shortest month of the year, February saw an average of 868 changes synced per team. When you consider the post-holiday blues and people’s vacations extending into January, it makes sense that it might take a month for things to really pick up. These numbers might also be the result of January being used as a “planning” month for the year, meaning February is when the hard work truly begins.
September was the third most productive month at 863 synced changes per team on average. This aligns with people picking things back up after the summer holidays come to an end, so no real surprise there.
But the big shocker is April. April was far and away the top month for changes synced, at 1,130 changes synced on average per team — beating out the next closest month by over 250 synced changes. For many businesses, April is the start of the fiscal year so that might explain it. We like to think that the end of the winter season just makes people happier. And happier people are more productive.
So which is the least productive month? That would be June at 677 average changes synced. Seems like as the weather heats up, productivity cools down.
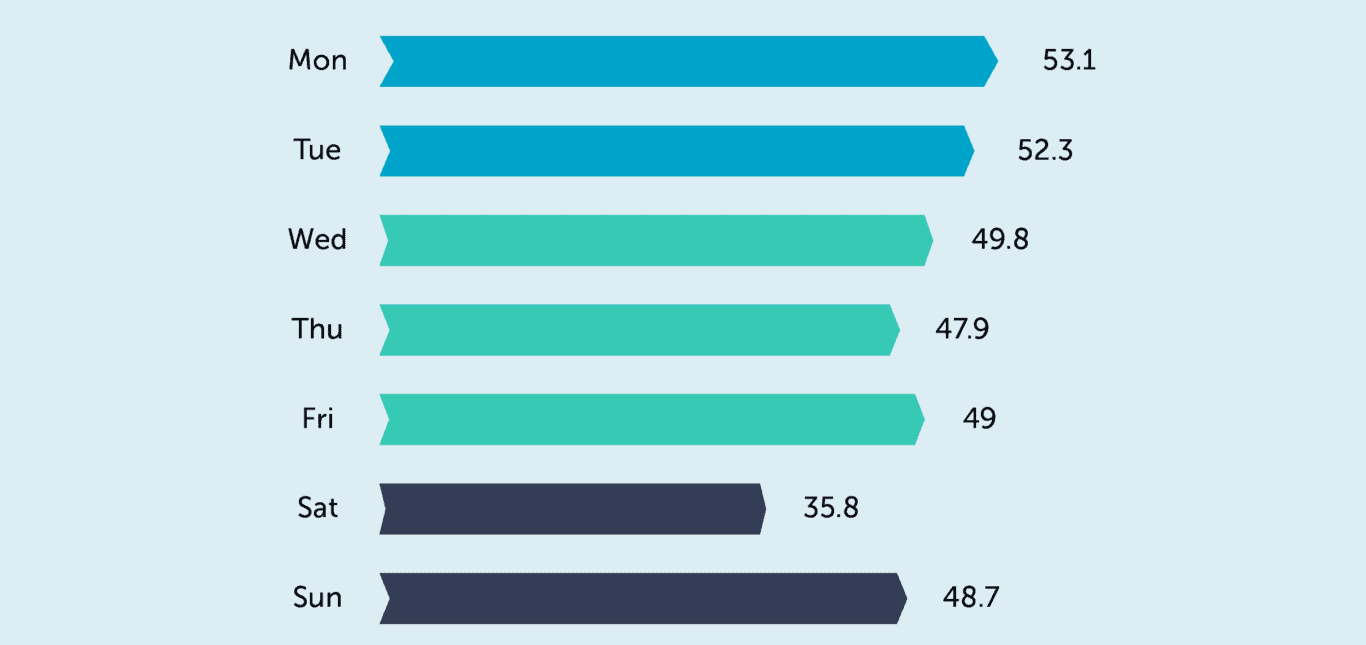
Thursday is the least productive day of the week
What day of the week do you get the most collaborative work done? According to our research, it probably isn’t Thursday.
We looked at the average number of synced changes on each day of the week. We found that things start off strong on Monday and slowly decrease throughout the week, except for a small surge on Friday. That leaves Thursday at the bottom of the pile, with 47.9 changes synced per team. To be fair, it’s not lagging behind Friday by much, at 49 synced changes on average.
But more surprising is that Sunday is a more productive day than Thursday. team sync an average of 48.7 changes on Sundays. Tech-savvy companies and startups tend to be far more flexible on hours than traditional businesses, and this might be a reflection of that trend. Many people also use Sundays to plan out their weeks, which could explain the jump in changes to tasks and projects. Or maybe people are just working more.
Jira, Wrike, and GitHub are highly-collaborative environments
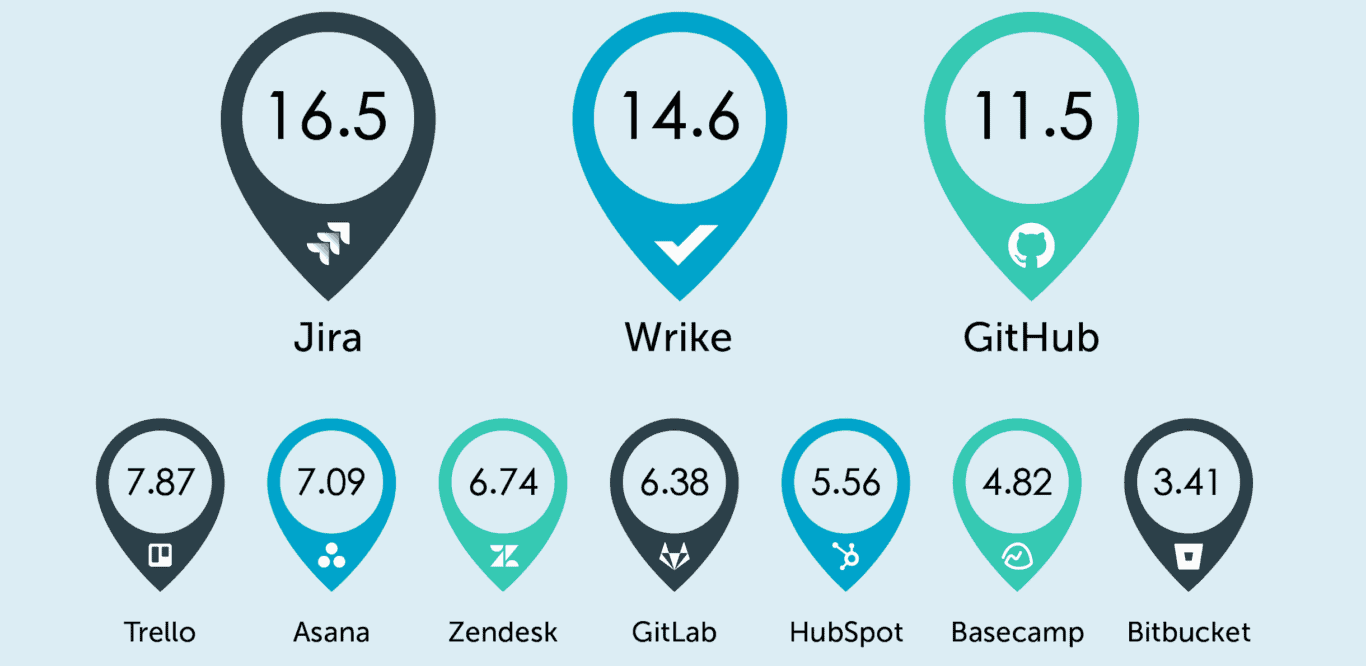
After looking at synced changes, we took a step backward and analyzed the average number of collaborators — any individual collaborating on synced projects — per tool among teams using Unito. So how many people are involved in these tools?
We found development tools to be highly collaborative. Jira was the most collaborative environment of all, with an average of 16.5 collaborators per team. Considering Jira forms the basis of countless development teams, this makes quite a bit of sense. GitHub was right up there as well, with an average of 11.5 collaborators. This is a testament to the GitHub community’s commitment to “open source everything.”
Sitting right in between these two tools is Wrike. Among less development-focused project management tools, Wrike is known as the solution for enterprises. With such a focus on large-scale businesses, the high number of collaborators — at 14.6 on average — seems pretty aligned with Wrike’s position in the market.
Trello and Jira are buzzing with activity
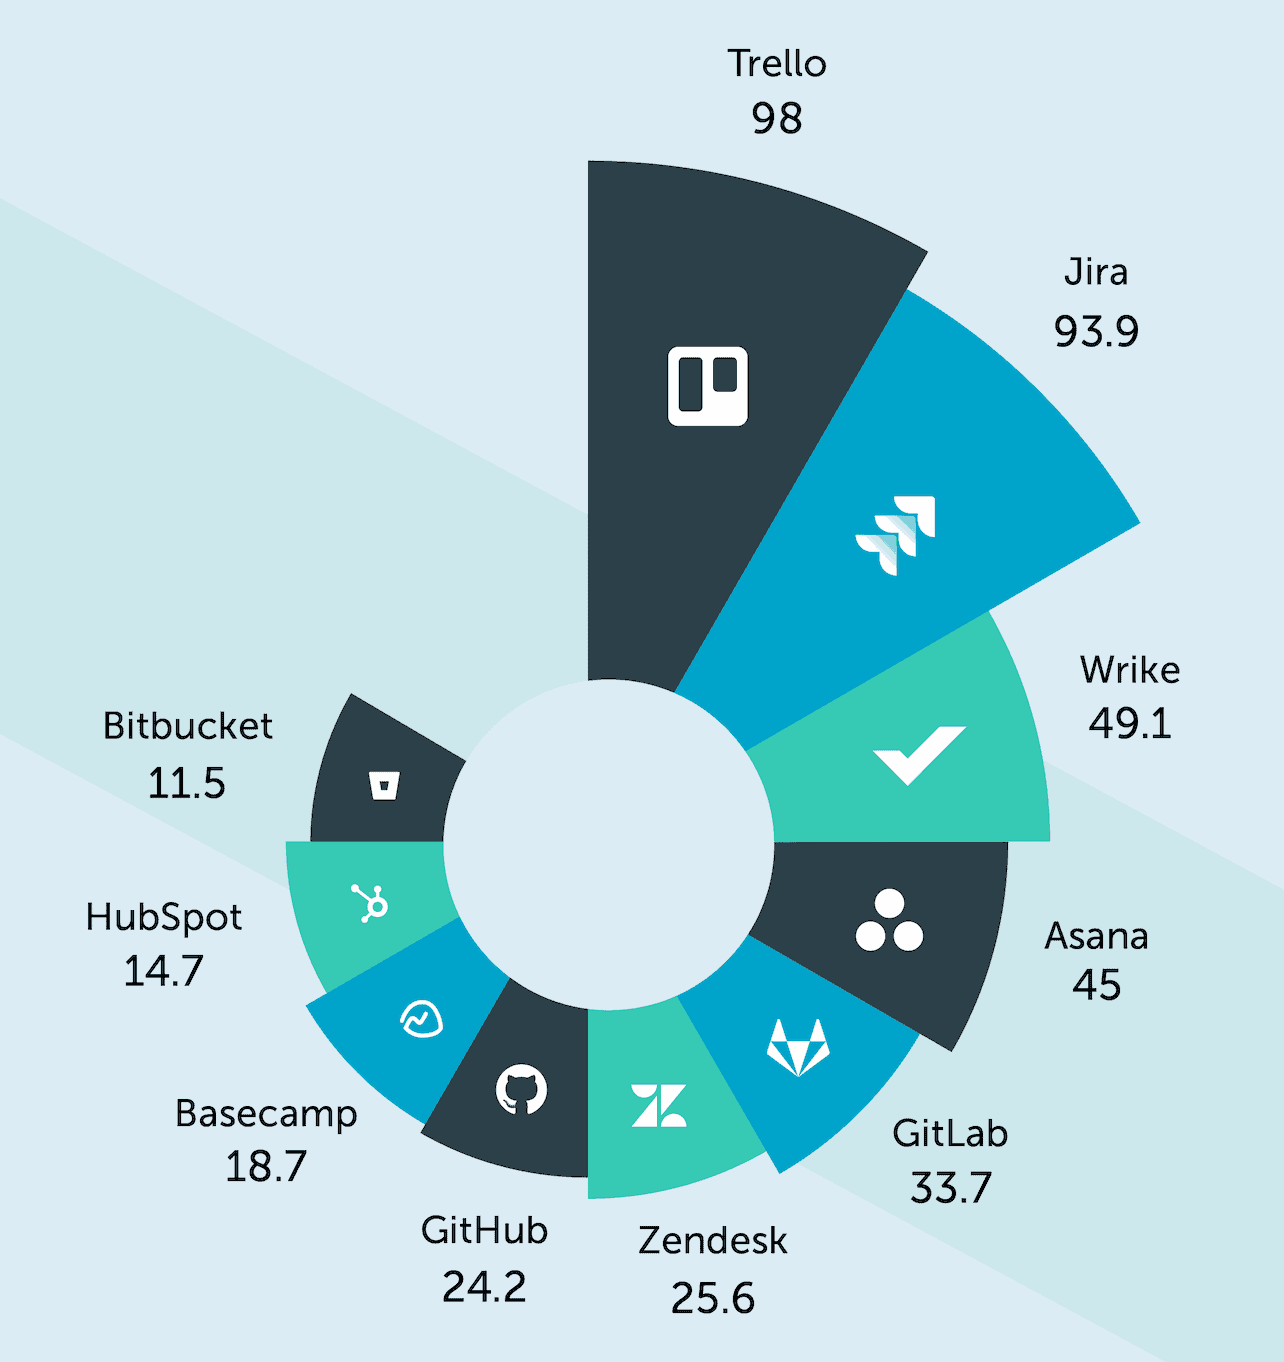
Just because you have a higher number of collaborators doesn’t mean you’re getting more work done!
Among all of our integration tools, Trello leads the way for average number of daily changes synced at 98. This could be a reflection of how Trello is being used — think daily to-do lists of achievable tasks being built and checked off fairly quickly. It might also reflect the fact that Trello cards are extremely customizable and each little change or feature is being reflected in their syncs.
Jira on-premise is second among tools with 93.9 average daily changes synced. Jira is often used as both an internal and external service tool, which could explain the high number of changes. Developers in Jira fix tech issues for their coworkers while crushing bugs for their end users, leading to a high volume of issue updates every single day. Many are also taking advantage of our two-way Trello Jira integration to improve communication, reduce busywork and streamline operational workflows.
Don’t work more. Work more efficiently, with the help of Unito. Build the workflows you need across projects, teams, and tools.
Try Unito for 14 days, absolutely free.