
How To Create a CRM in Notion Using Unito [With Template]
Need to give your teams a CRM, but you don’t want to bust your budget? Here are a few steps you can take to turn Notion into the custom CRM your teams need.
HR Reporting: What It Is and Some Essential Reports
HR reporting is all about making sure your teams have everything they need to perform at their best. Here’s how it works.

Eat the Frog: Get Your Most Difficult Work Done First
Mark Twain said that if it’s your job to eat a frog, best to do it first thing in the morning. And if you have to eat two, best start with the biggest one. Here’s what that means for your work.

Slack Productivity: 15 Tips for Teams of All Sizes
Slack, the instant-messaging app of choice for many, can either help or hinder your productivity. Here’s how to stay productive in Slack.

Why Automated Reporting Templates Are Essential To Your Workflows
Reporting is essential, but it can take hours to get right. Unless you use an automated reporting template. Here’s why.
How Master Data Management Can Streamline Operations for All Teams
Master data management means having a single source of truth from which data flows to other platforms. Here’s why that’s important.

How Technical Teams And Non-Technical Teams Can Better Communicate
Poor communication is expensive. You miss opportunities and lose productivity. Here’s how to keep that from happening.

How To Make a Business Case for Unito
Need to convince someone that the whole team should be using Unito? Here’s how you can make the best argument.
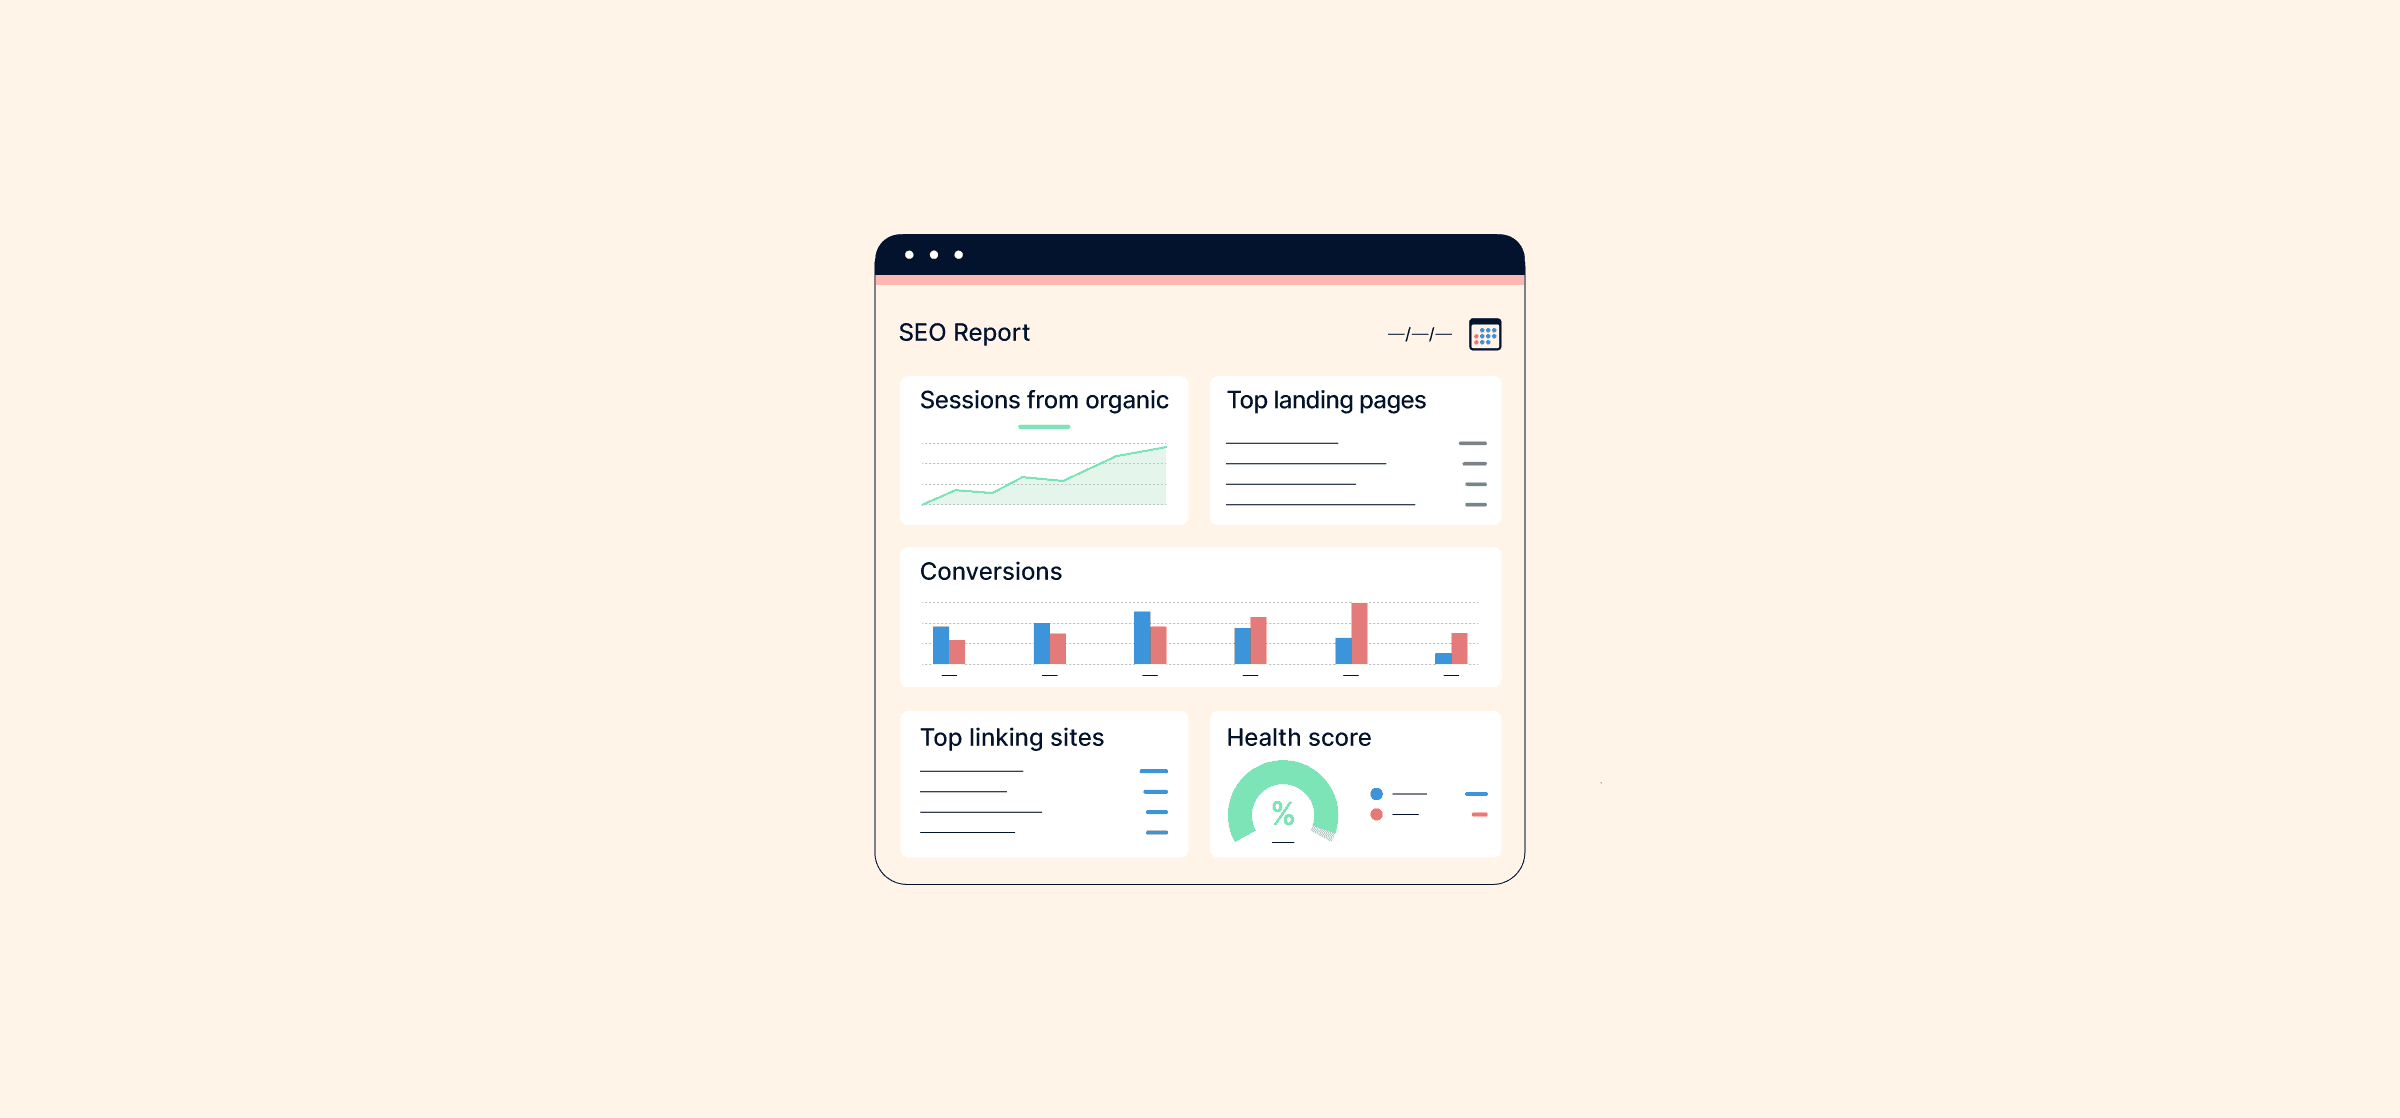
5 Free Templates for Your Next SEO Report
An SEO report will tell your team how well your website is ranking in Google search results and tell them what to do next. Here’s how to create your own.

The 10 Best Zendesk Apps for Customer Support Teams
The best Zendesk apps make your customer support team’s life easier by streamlining their work and automating repetitive tasks. Here’s how.

What Is a Project Charter? (And 6 Templates)
The project charter is the blueprint for what you’re going to get done and how you’ll be doing it. Here’s how you can create your own.