Free Template: Automated Google Analytics 4 Dashboard in Google Sheets
Google Analytics (GA4) is an essential tool for every marketer due to the valuable insights it contains. Rare is the marketing initiative that doesn’t involve data from this popular tool at some point in the process. But while it’s great at collecting and aggregating the data you need, it’s not always the best way to share that data across the team or even with other departments. A well-built spreadsheet report is usually best, but manually transferring and updating data any time a report a due can slow down your reporting cycle significantly.
That’s where Unito’s integration for GA4 and Google Sheets comes in. It takes just a few minutes to set up, and then it automatically exports data from GA4 to Google Sheets, automatically keeping it all up to date whenever that data changes. But what do you do with it once it’s in Google Sheets?
With this template from Unito, you don’t even have to think about it. Here’s how you can combine this purpose-built report with a Unito integration for up-to-date GA4 data wherever you need it.
What this free template includes:
- A high-level, aggregated view of your website performance including sessions, engagements, and conversions
- Weekly sessions chart
- Top landing pages by sessions chart
- Sessions by medium chart
- Custom date range picker
How to use this template with Unito
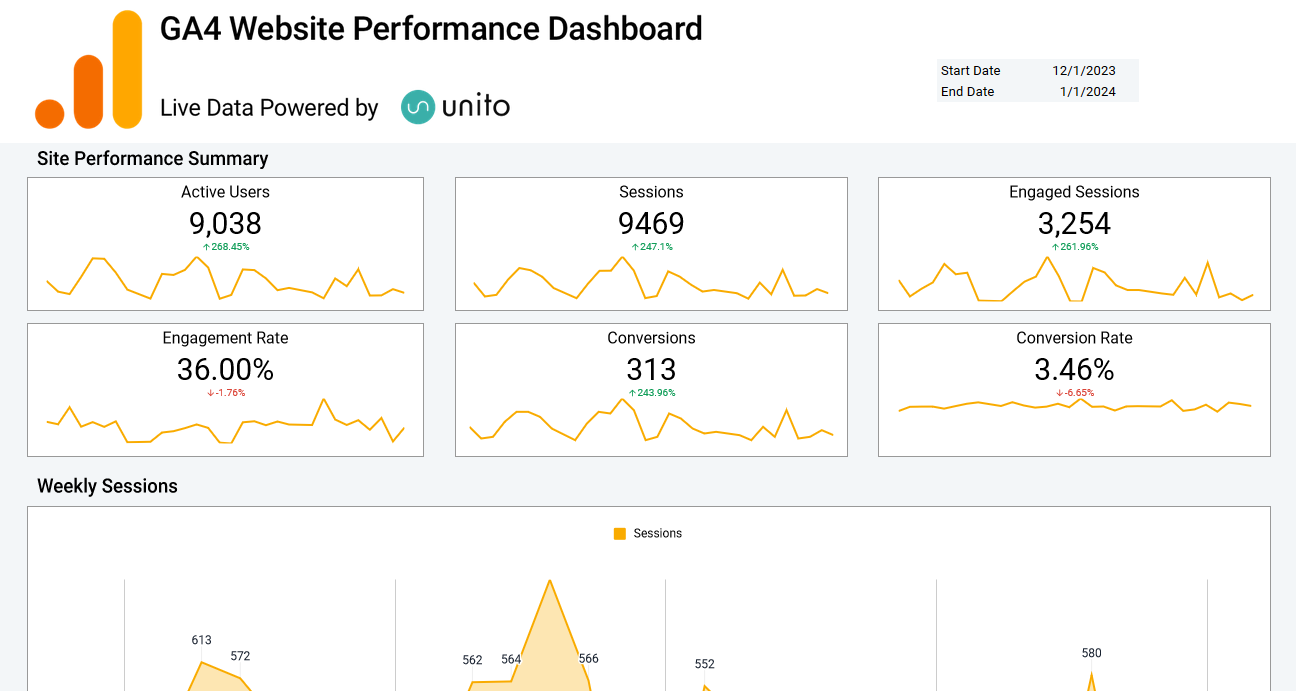
This template uses data from the “Raw_Data” tab to generate charts and visualizations. While you could manually add your Google Analytics 4 data here, it’s a lot easier when your spreadsheet is kept up to date with Unito’s integration.
Here’s how it’s done.
Step 1: Make a copy of the template
Hit File then Make a copy.
Step 2: Sign up for a 14-day trial with Unito
You’ll need a Unito account to keep data in sync between Google Analytics and Google Sheets. You can start a free trial right here.
Step 3: Build a flow with Google Analytics and Google Sheets
We’ve included steps below that’ll walk you through this process. You can also follow the rules and field mapping settings below.
Ready to visualize your GA4 Data?
Step-by-step instructions for setting up a Unito flow
This template is pre-formatted to turn Google Analytics data into a powerful website performance dashboard built right into a spreadsheet. It works best when you use Unito to feed that data into Google Sheets automatically.
Step 1: Connect GA4 and Google Sheets to Unito and pick your blocks of work
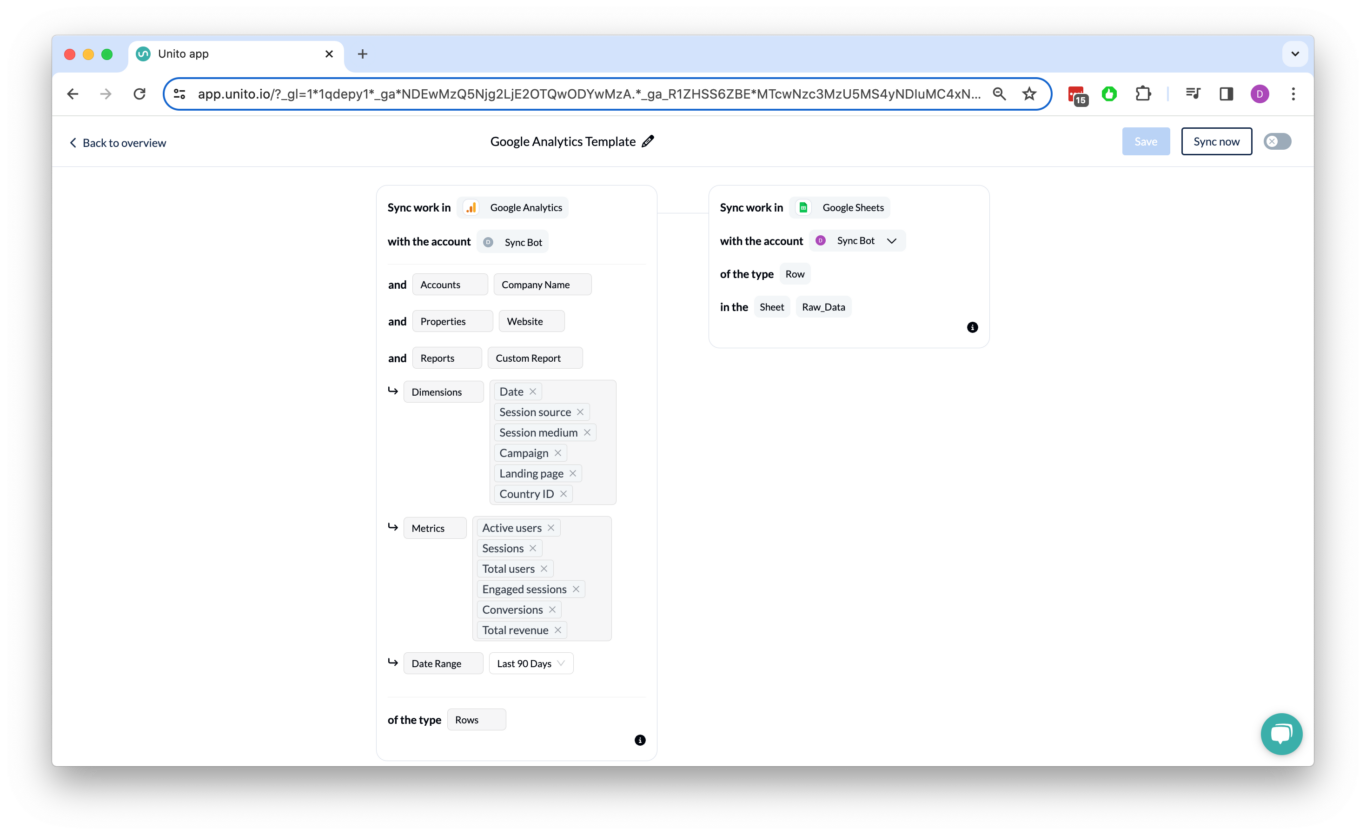
You can connect both Google Analytics and Google Sheets using your Google account. You’ll then need to choose the account that will sync information across and the property you want to sync it from. From there, make sure to do the following:
- Select Date, Session source, Session medium, Campaign, Landing page, and Country ID as GA4 Dimensions.
- Select Active users, Sessions, Total users, Engaged sessions, Conversions, and Total Revenue as GA4 Metrics.
- Choose a predefined or custom GA4 Date Range.
- Select “Raw Data” as your desired Google Sheets sheet by pasting the URL.
Install our Spreadsheet Sync Add-On for Google Sheets.
Step 2: Add rules (optional)
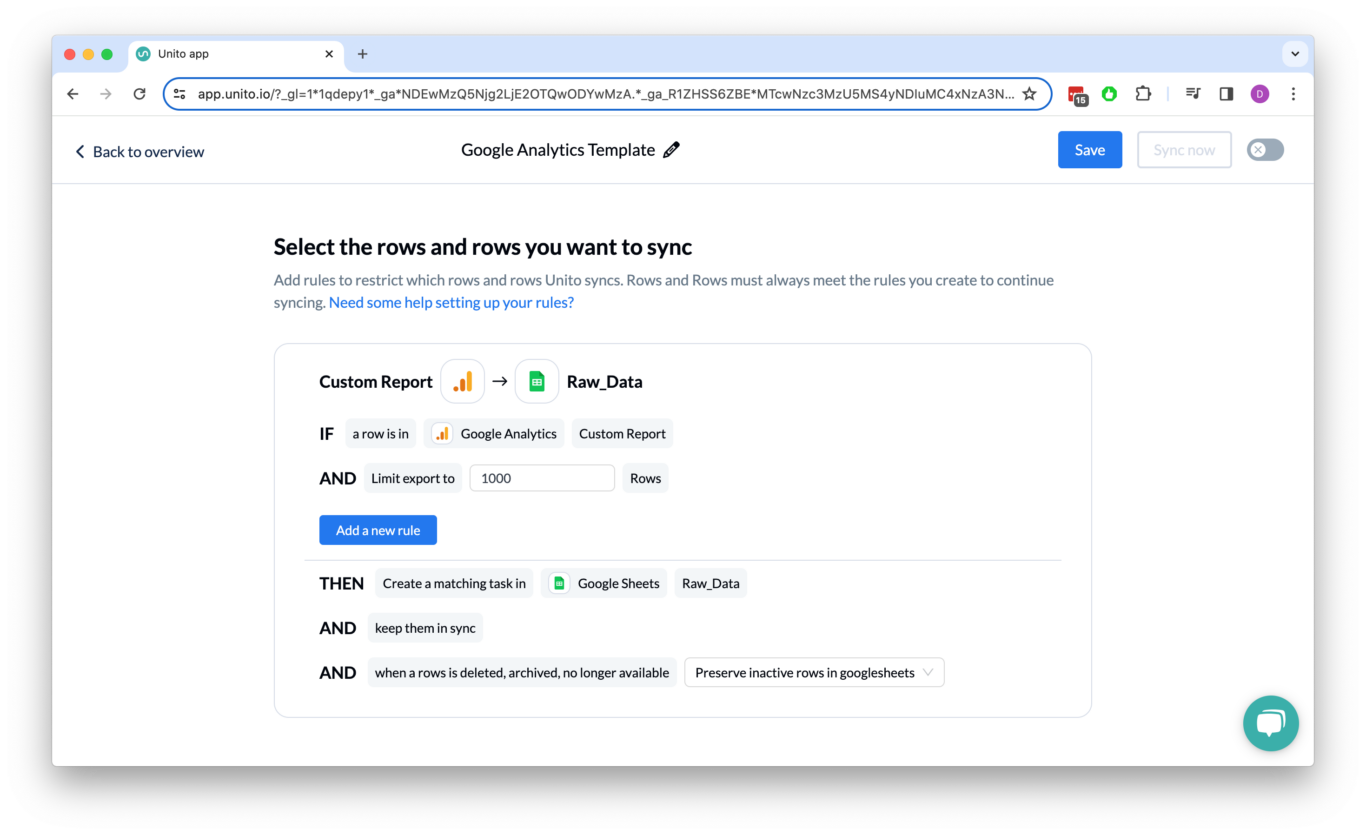
Rules let you customize how much information is synced from Google Analytics to Google Sheets. You could filter out rows with Dimensions that don’t match a specific value or Metrics that are less than a certain amount. You can also limit the number of rows you sync overall.
Step 3: Map your fields
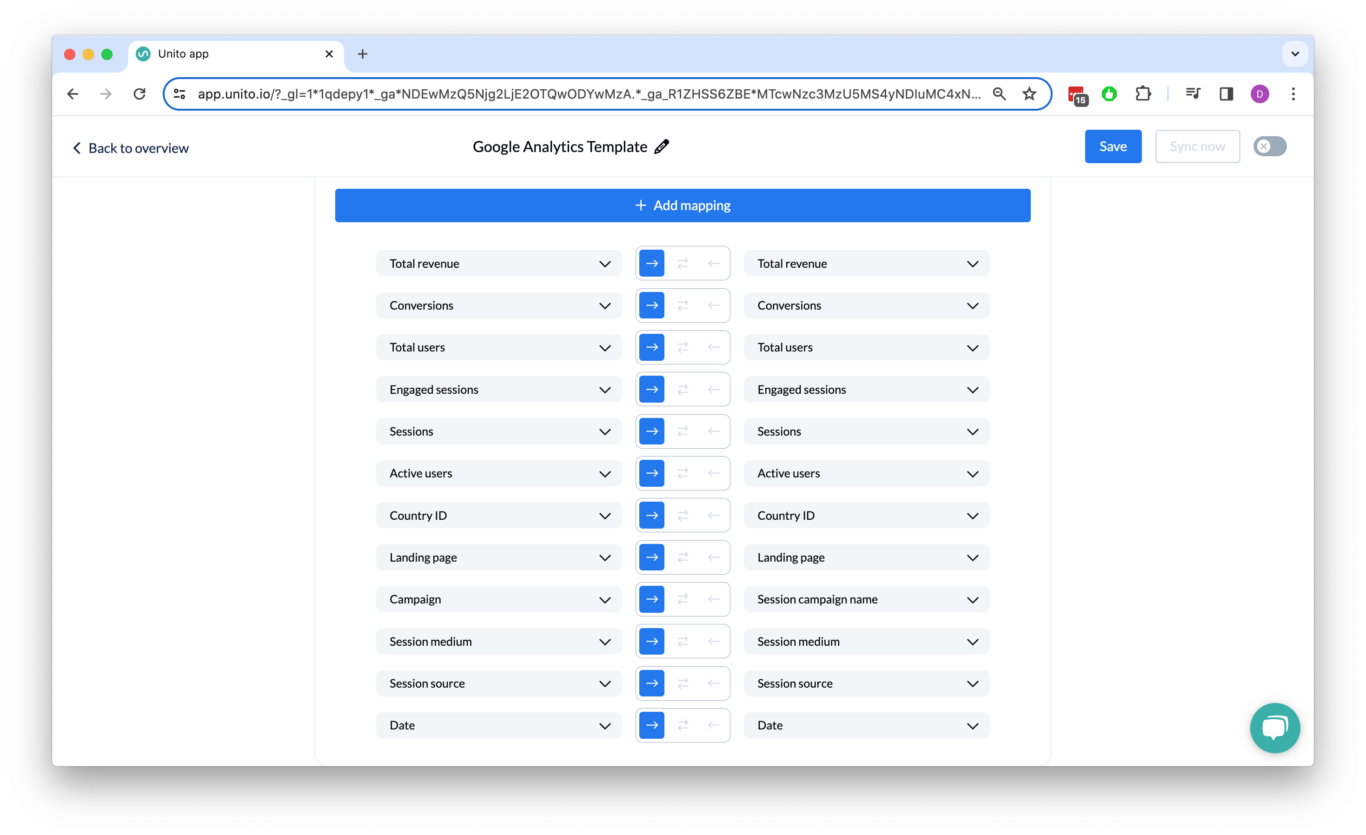
Field mappings allow you to match columns in Google Analytics with those in Google Sheets so your data always ends up in the right place.
Step 4: Launch your flow!
After mapping your fields, you’re good to go! Now just sit back and watch as rows from Google Analytics are synced to your report in Sheets.

