
Jira Supercharged: Mastering Agile Workflows
Jira has a ton of features that can help agile software teams get more done in less time. Here’s our guide to doing that.

11 of the Best Airtable Extensions on the Market
Airtable extensions allow you to get even more out of this flexible tool. Here are 11 of the best and what they can do for you.
How to Use Excel: A Guide for Beginners
Learn how to use Excel with our beginner’s guide covering essential tips, tricks, and functions to master spreadsheet management. Boost your productivity and organize data like a pro.
How to Sync Google Contacts to a Central Database Using Unito
Need to get contact information out of Google Contacts and into a database? Here’s how you can use Unito to sync contact info from Google Contacts to a database in Notion.

How To Create a CRM in Notion Using Unito [With Template]
Need to give your teams a CRM, but you don’t want to bust your budget? Here are a few steps you can take to turn Notion into the custom CRM your teams need.

A Guide to Trello for Beginners: Creating Boards, Cards, and More
Need a primer on using Trello? In Unito’s guide, you’ll learn how to create boards, how cards work, and more.

How to Sync monday.com Tasks to Google Calendar with Automated 2-Way Updates
Share launch campaign info, dates, events and more between monday.com and Google Calendar with an automated 2-way sync.

How to Sync Mailchimp Contacts to an Enriched Contact Database With Unito
With Unito’s Mailchimp integration, you can sync contacts to an enriched database, from which everyone can contribute to your campaigns. Here’s how it’s done.
How to Sync Confluence Pages with Trello Cards Automatically
Set up a 2-way sync between Confluence and Trello to share documentation, tasks, data and more with Unito’s automated integration.

ClickUp vs. Jira: Which Tool Is Best for Your Projects?
When comparing ClickUp vs. Jira, the work your team will do, the collaboration features you need, and the price will be big deciding factors. Here’s the full breakdown.
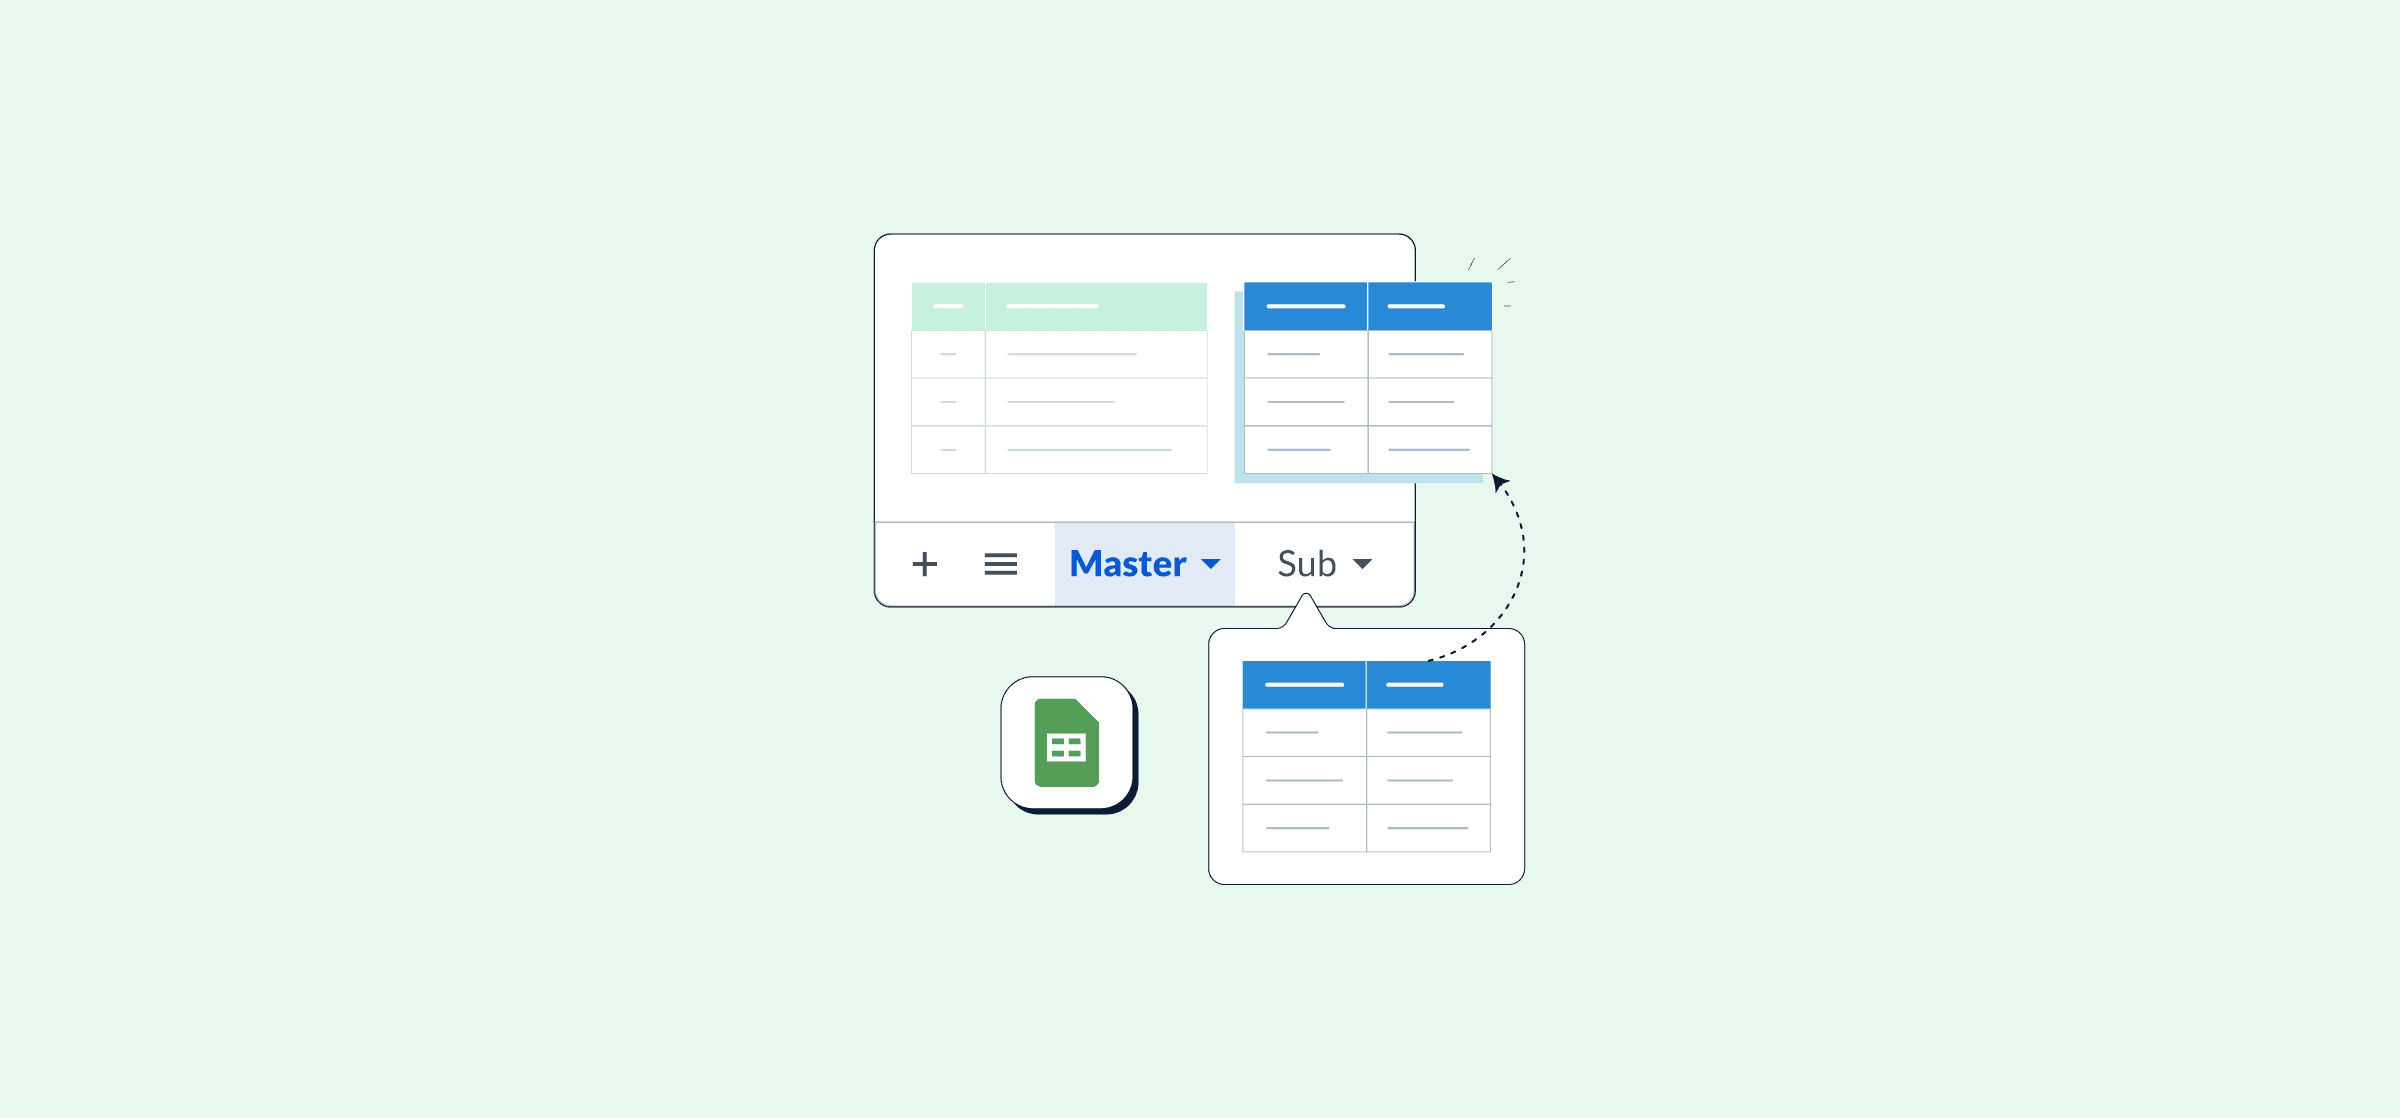
The Master Sheet: How To Oversee Multiple Trello Boards With a Spreadsheet
A master sheet is a spreadsheet that syncs with Trello so you can review work from multiple boards in one place. Here’s how to make one.
