
A Guide to Trello for Beginners: Creating Boards, Cards, and More
Need a primer on using Trello? In Unito’s guide, you’ll learn how to create boards, how cards work, and more.

How to Sync Mailchimp Contacts to an Enriched Contact Database With Unito
With Unito’s Mailchimp integration, you can sync contacts to an enriched database, from which everyone can contribute to your campaigns. Here’s how it’s done.

How to Sync Confluence Pages with Trello Cards Automatically
Set up a 2-way sync between Confluence and Trello to share documentation, tasks, data and more with Unito’s automated integration.

ClickUp vs. Jira: Which Tool Is Best for Your Projects?
When comparing ClickUp vs. Jira, the work your team will do, the collaboration features you need, and the price will be big deciding factors. Here’s the full breakdown.
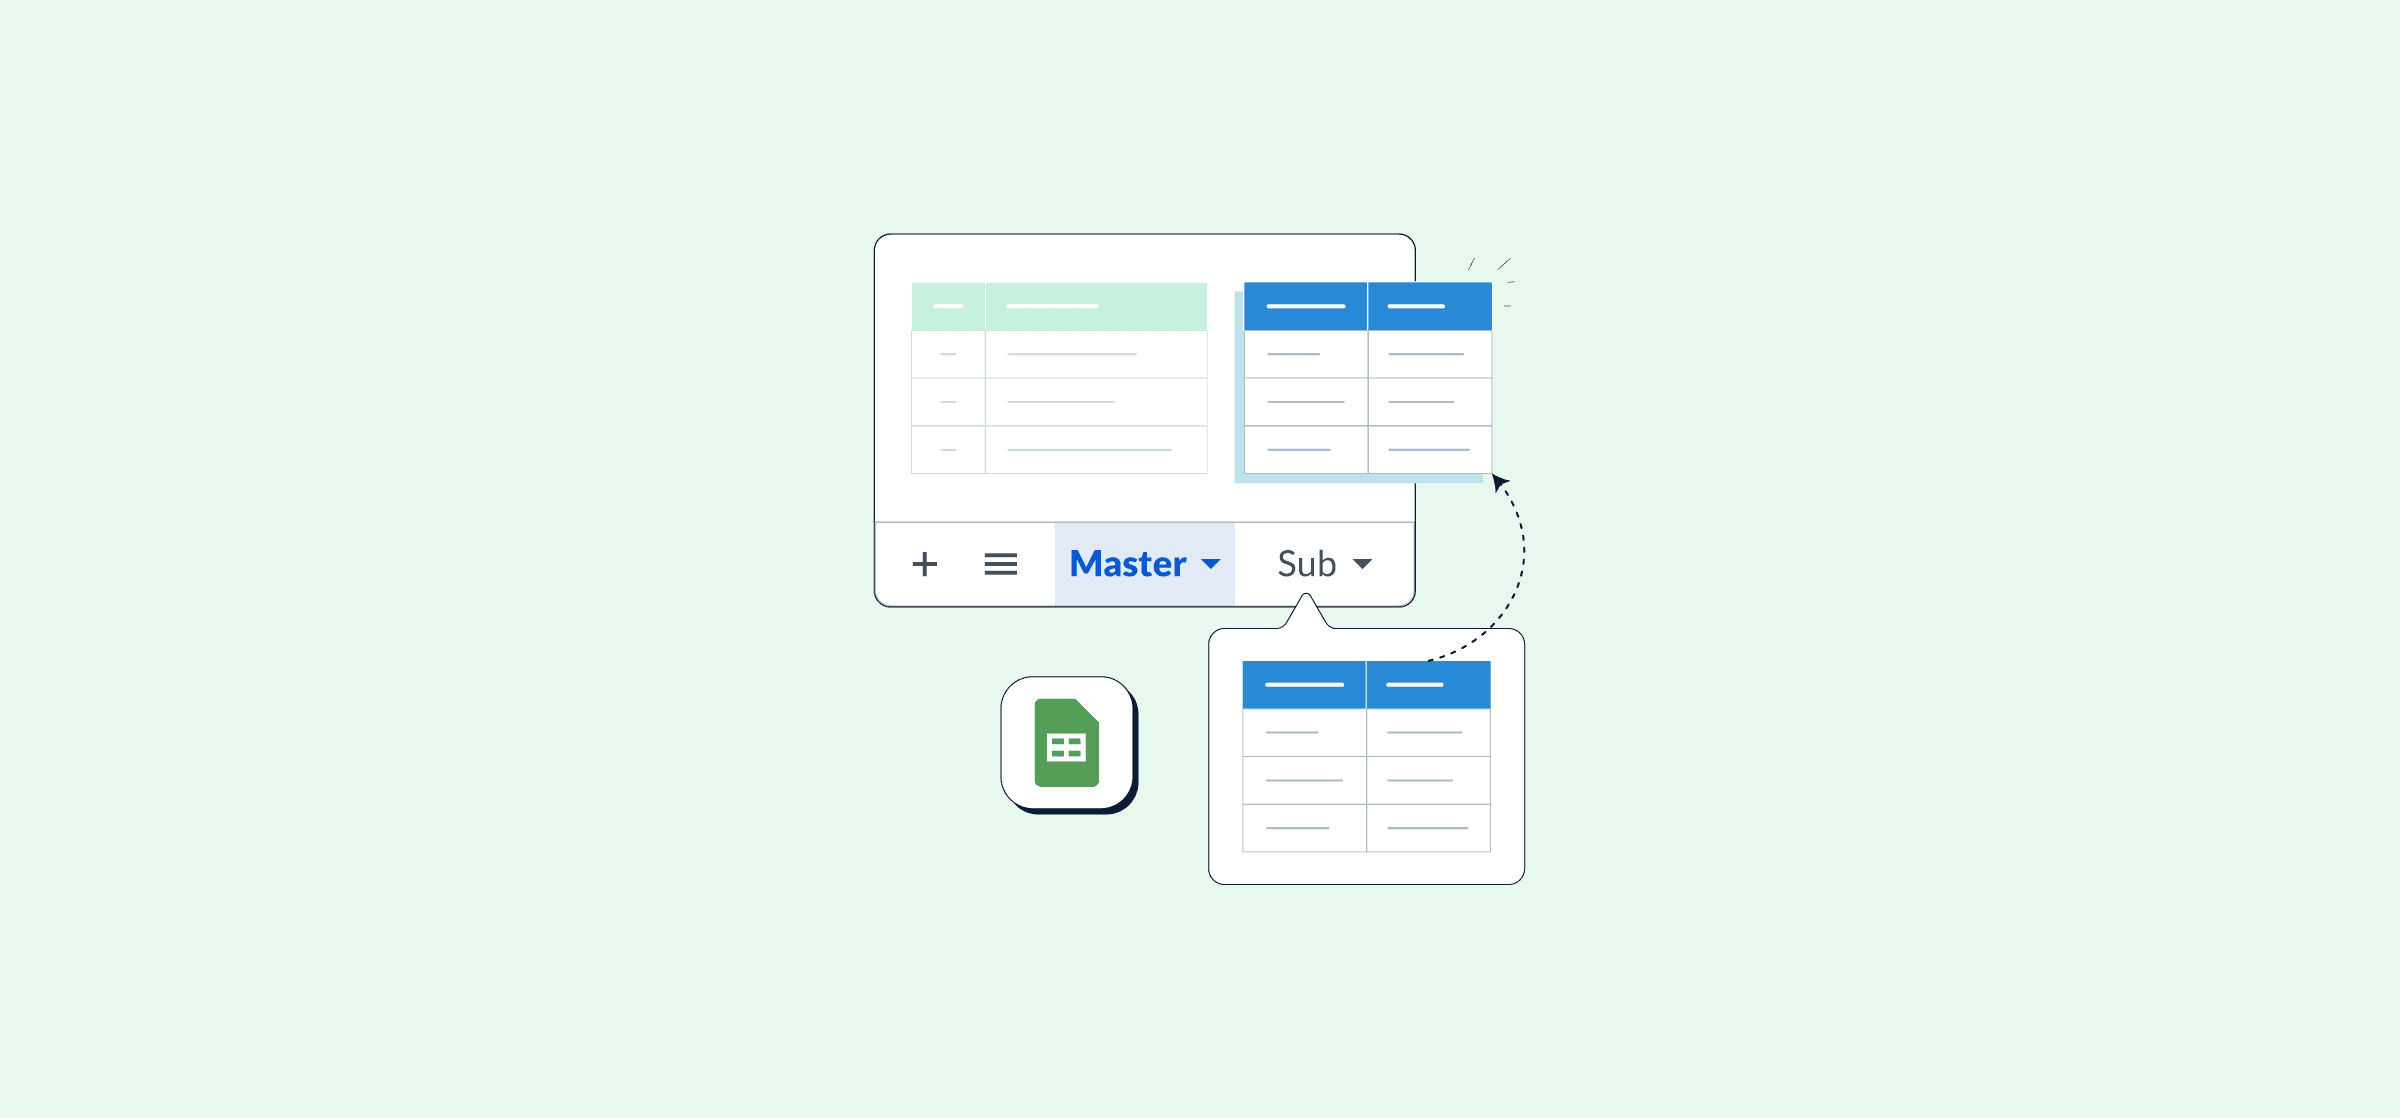
The Master Sheet: How To Oversee Multiple Trello Boards With a Spreadsheet
A master sheet is a spreadsheet that syncs with Trello so you can review work from multiple boards in one place. Here’s how to make one.

Why Automated Reporting Templates Are Essential To Your Workflows
Reporting is essential, but it can take hours to get right. Unless you use an automated reporting template. Here’s why.

How To Make a Business Case for Unito
Need to convince someone that the whole team should be using Unito? Here’s how you can make the best argument.

5 Free Templates for Your Next SEO Report
An SEO report will tell your team how well your website is ranking in Google search results and tell them what to do next. Here’s how to create your own.

How to Consolidate Data in Excel (2 Methods)
You can combine data from multiple excel sheets through Excel’s built-in consolidate feature or with a platform like Unito.

The Best Examples of Marketing Reports and KPIs in 2025
Marketing reporting lets marketing teams use data to make better decisions, focus on the right initiatives, and get more results.
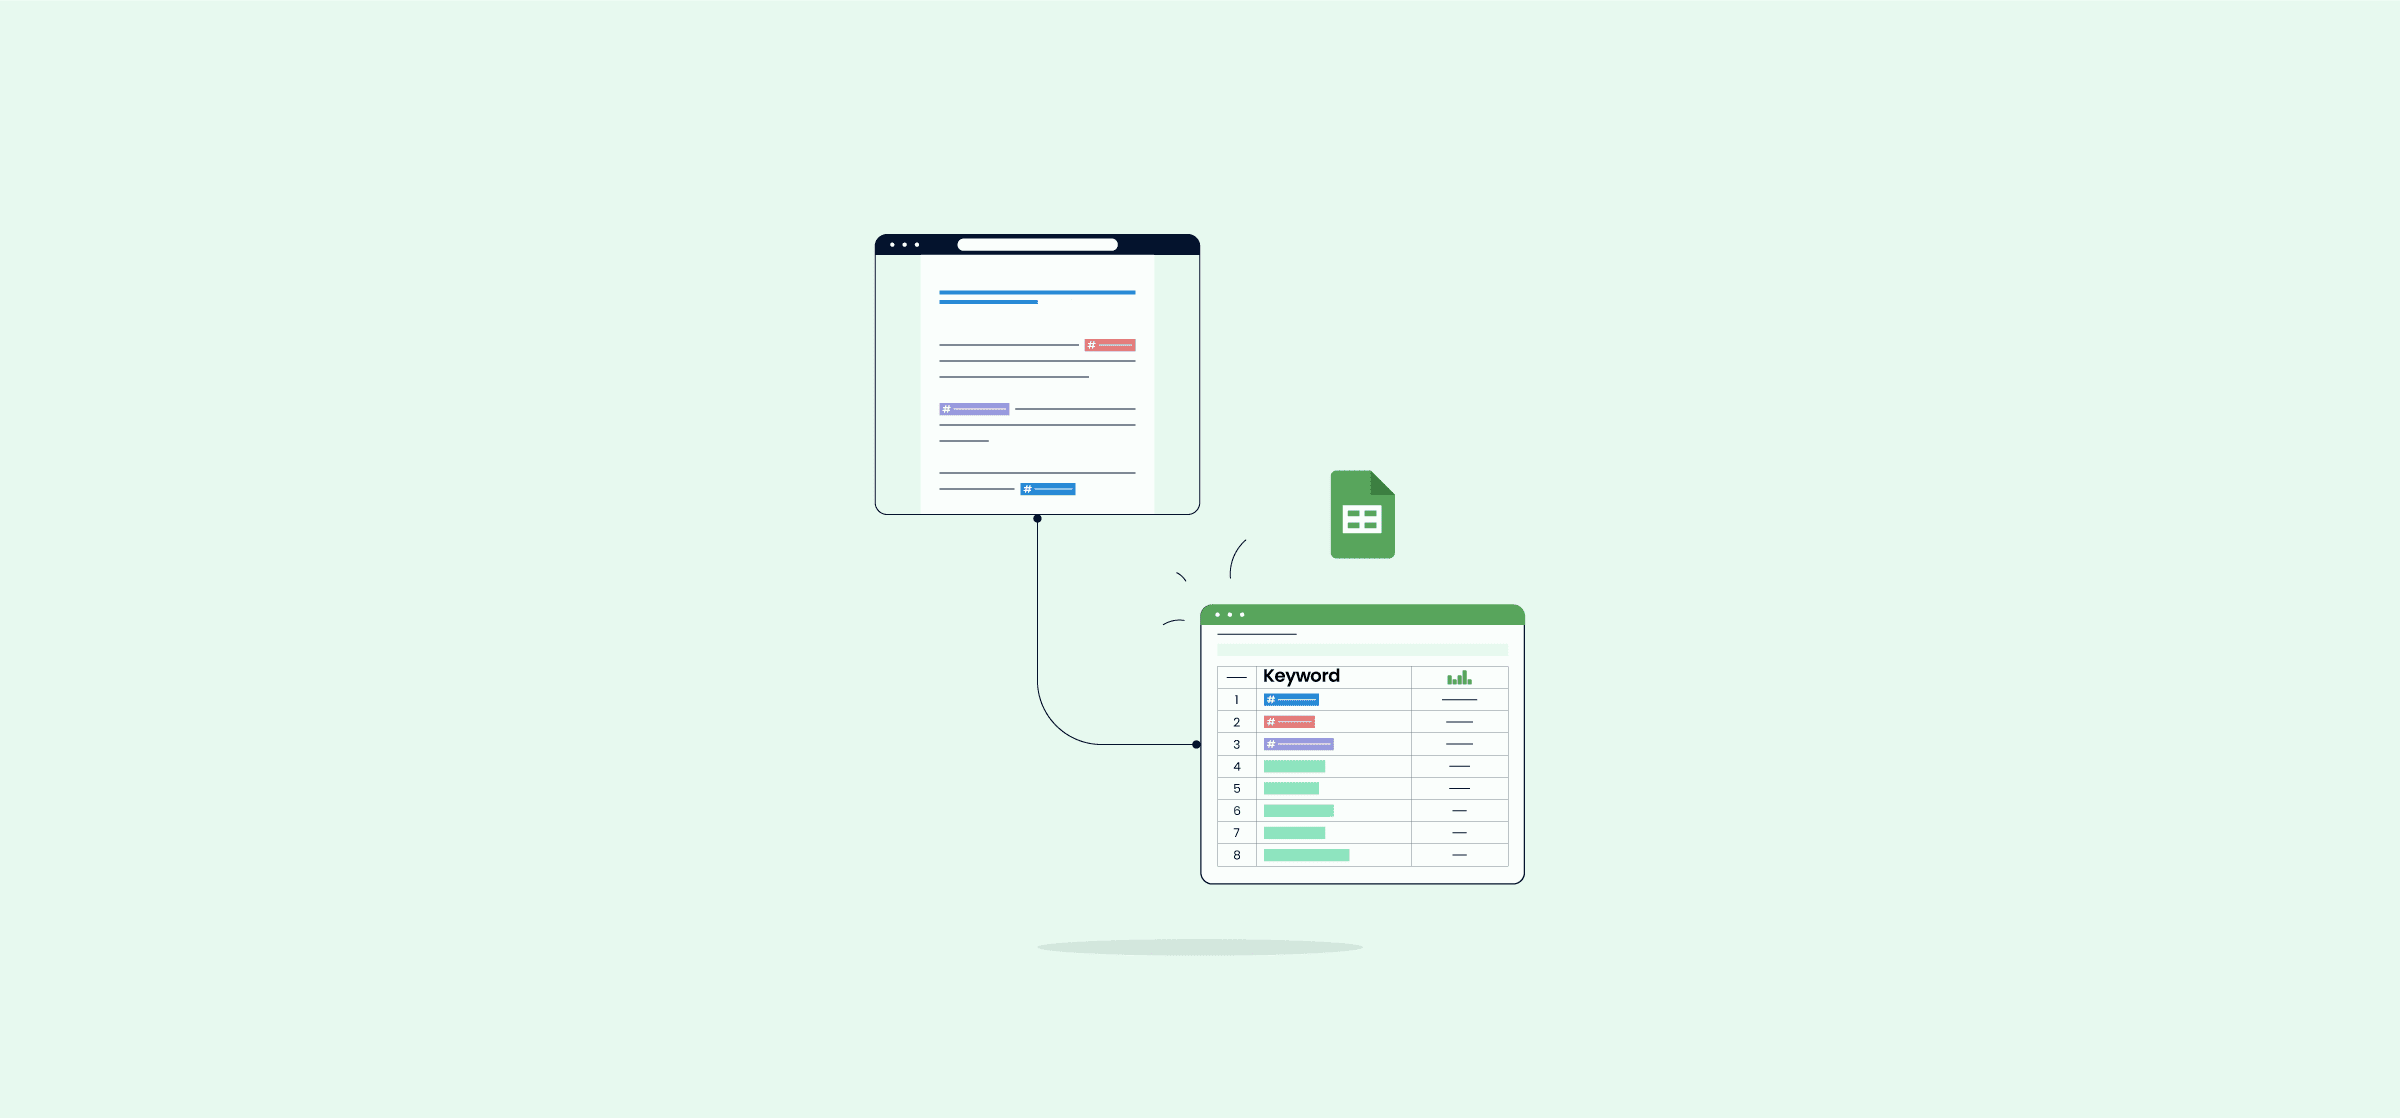
The Ultimate Guide to Automated Reporting
With automated reporting, you can build reports faster and more accurately than you could manually. Here’s how that works.
