The Ultimate Guide to Automated Reporting
With automated reporting, you can build reports faster and more accurately than you could manually. Here’s how that works.
What is Project Portfolio Management?
If you’re a project manager who’s constantly juggling multiple projects, stakeholders, team members, and business goals, you know just how easy it is to get wrapped up in the smaller details of your day-to-day work. […]
Airtable vs. Notion: Which Database Tool is Best for You?
When comparing Airtable and Notion, you need to know how big of a database you need and how customizable it has to be. Here’s the breakdown.

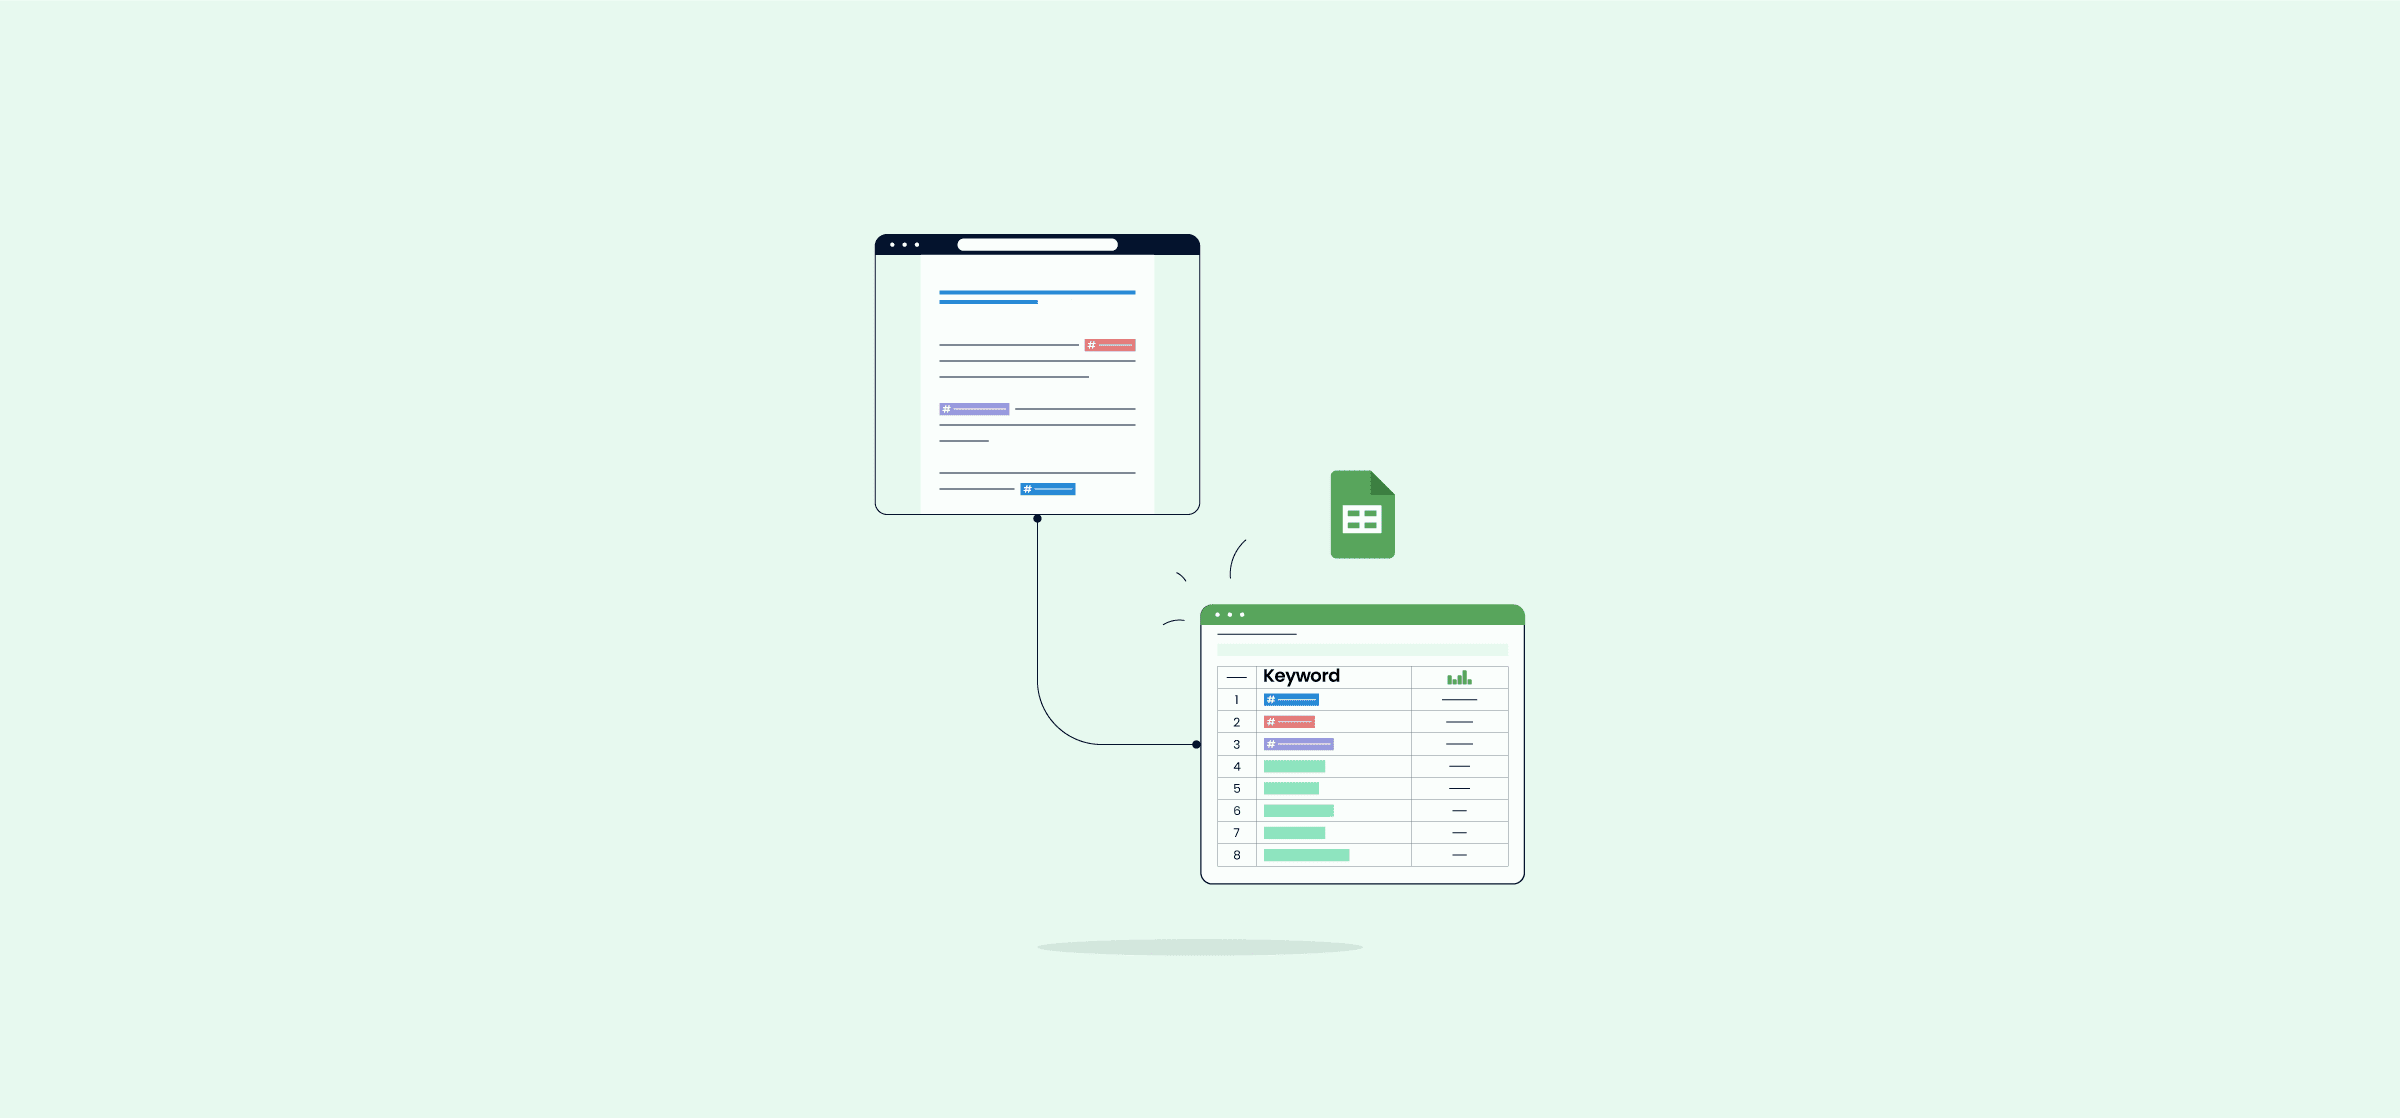
Data Aggregation 101: What It Is and What It Can Do for Your Team
Data aggregation is about bringing data from multiple sources into a single place and making it more accessible for your team. Here’s how.
How to connect MeisterTask to Google Calendar automatically with 2-way sync
Here’s how quick and easy it is to connect and sync Meistertask with other apps or tools with Unito’s automated 2-way integration

How To Use Vlookup in Excel From Another Sheet
Here’s how you can use VLOOKUP in Excel to pull data from another sheet in just a few clicks. It’s not that hard!
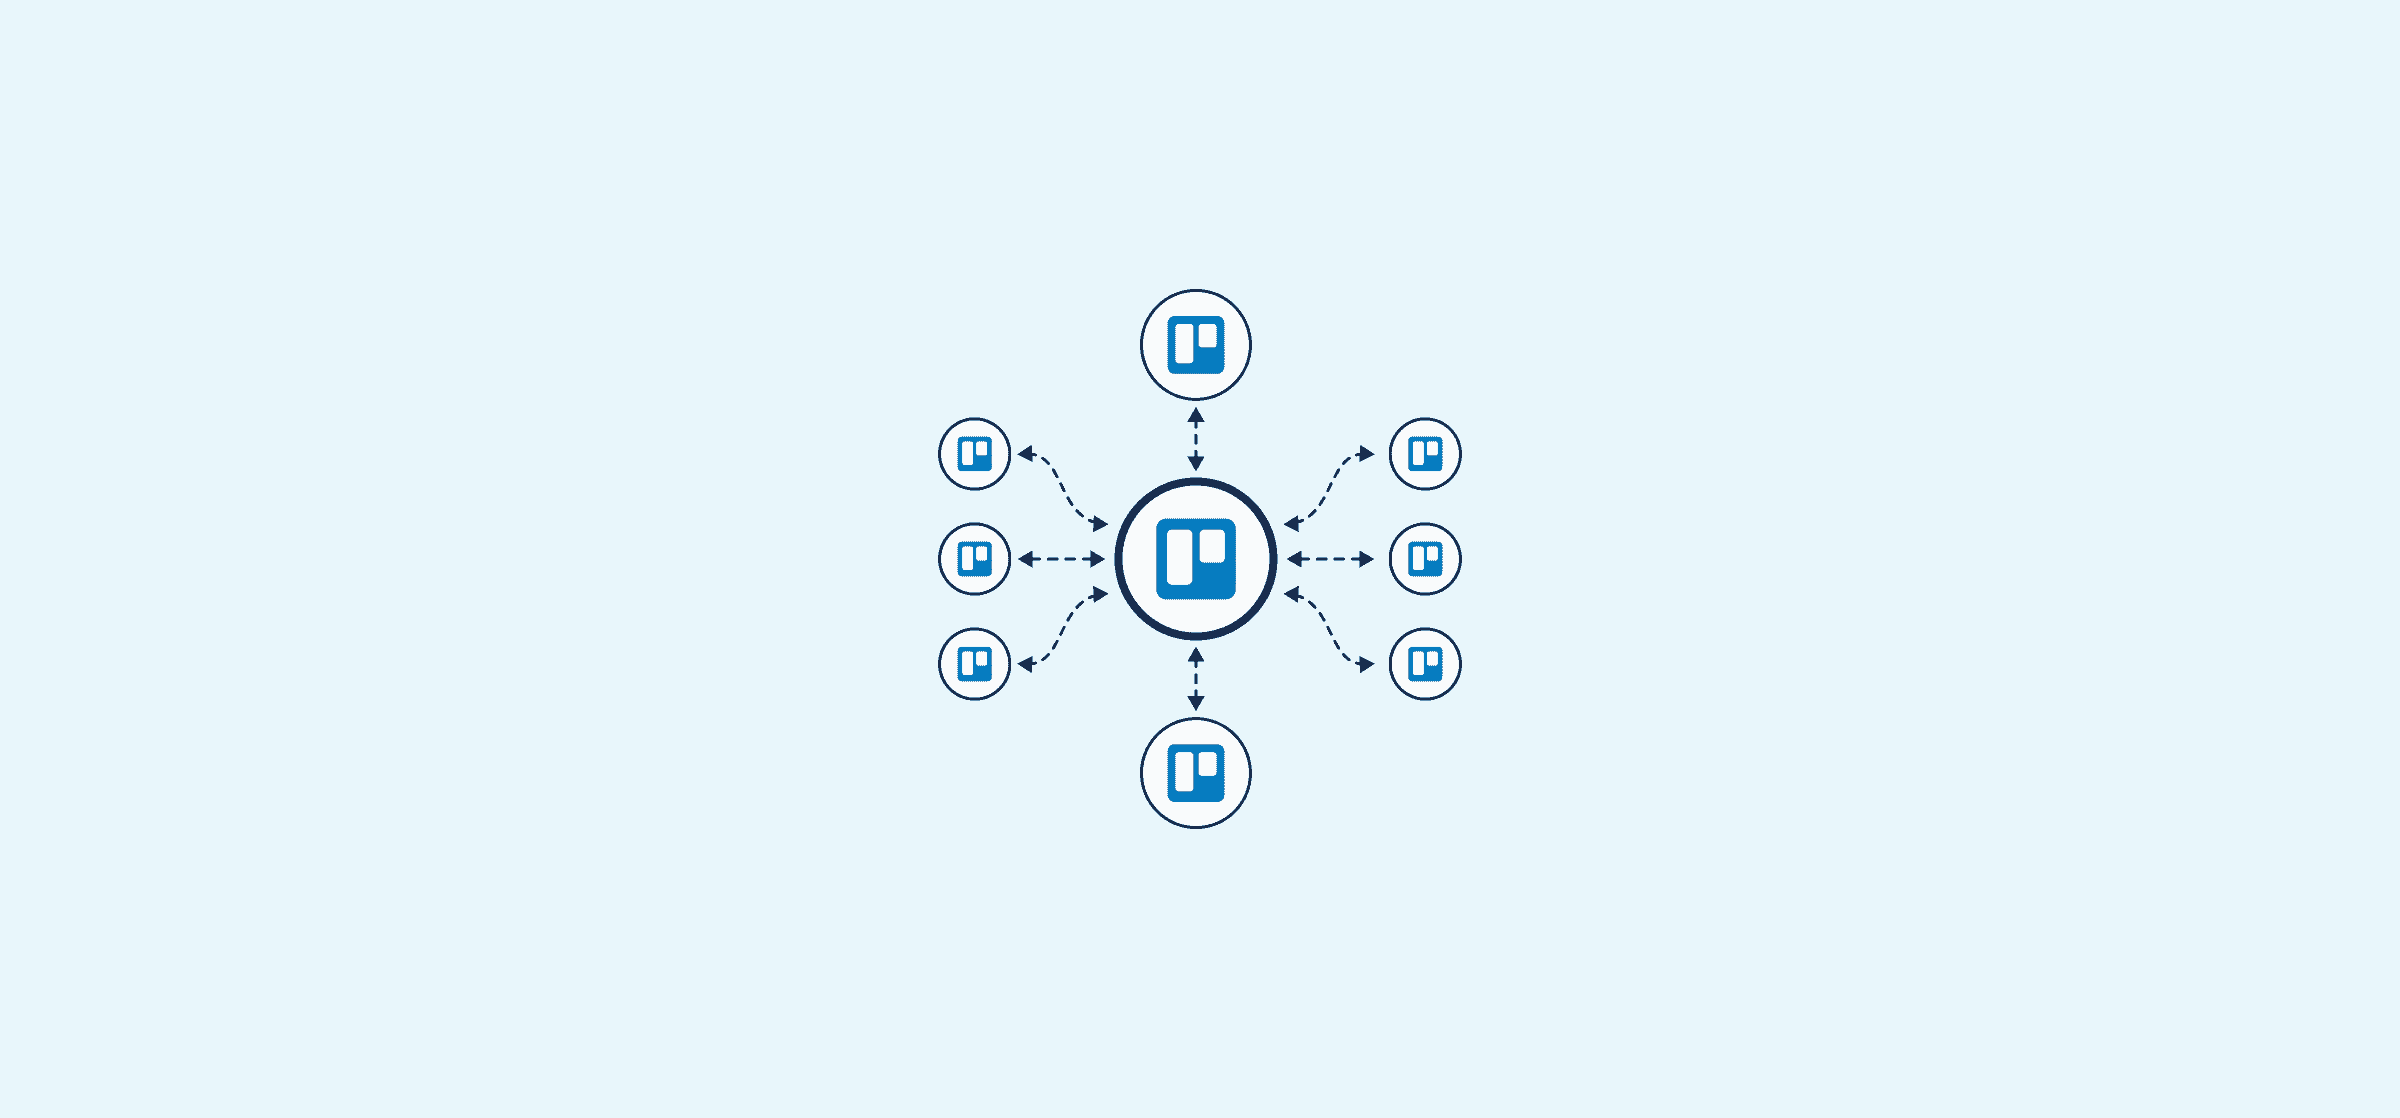
How to Build a Hub Board in Trello
A hub board is essential for syncing Trello cards between multiple Trello boards. Here’s how you can build your own with Unito.

The Weekly Status Report: What It’s for and How It’s Done (With Templates)
A weekly status report helps keep teams aligned, stakeholders informed, and projects moving smoothly. Here’s how to make yours work.

The Marketing Automation Platform: How to Squeeze More Work Out of Every Hour
With a marketing automation platform, your marketing team can get more out of every work day by automating mundane tasks and streamlining processes. Here’s how.
Sales Velocity: What It Is and How It’s Measured
Sales velocity is a metric that sales leaders and their teams can use to gauge their performance. Here’s how it works.
The Marketing Dashboard: What It Is and How To Make Your Own
With a marketing dashboard, you can bring all your data in one place, giving everyone the ability to make better decisions. Here’s what your dashboard absolutely needs.