A Complete Guide to Wrike Integration
While it’s a popular project management tool, Wrike is rarely the only tool your teams use. Here’s Unito’s guide to Wrike integration.
A Complete Guide to monday.com Integration
While it’s a popular project management tool, monday.com is rarely the only tool your teams use. Here’s Unito’s guide to monday.com integration.

ServiceNow Jira Service Management Integration: No-Code Setup Guide
Integrate ServiceNow and Jira Service Management with Unito’s no-code 2-way sync, without relying on ServiceNow’s JSM Spoke.
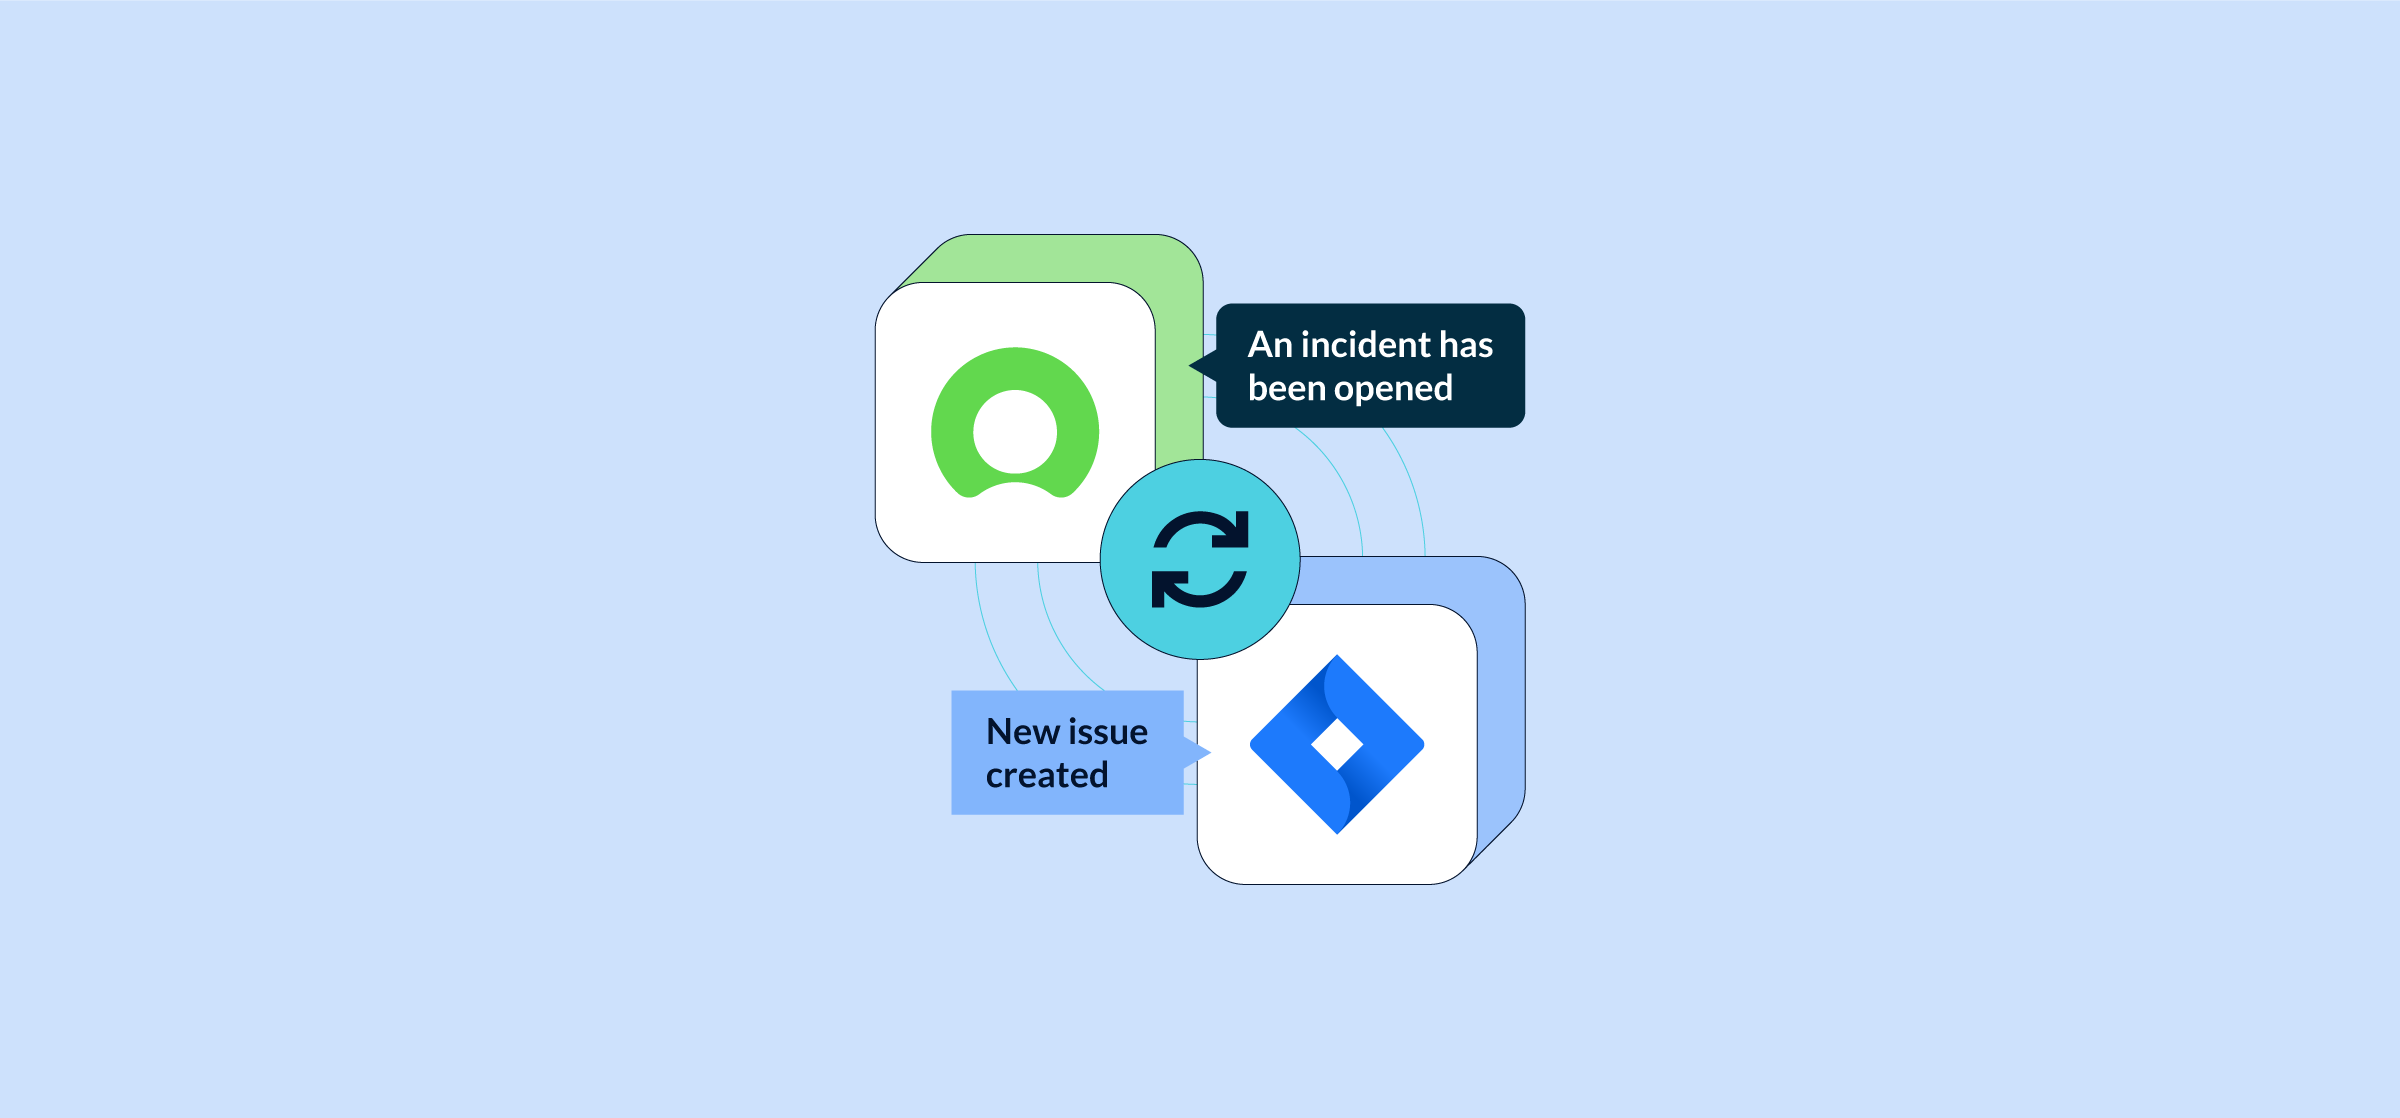
ServiceNow Jira Integration: Low-Code Setup Guide for ITSM Teams
Connect ServiceNow incidents with Jira issues using Unito’s no-code 2-way sync. An alternative to the Jira Spoke that bridges ITIL service desks and Agile dev teams in minutes.

Project Management Automation: 8 Use Cases, Benefits, and Tools (2026)
Project management automation can save you time, eliminate mistakes from manual data entry, and more. Here’s our breakdown of how these automations work and what they’ll do for you.
A Complete Guide to NetSuite Integration
NetSuite is a popular tool for enterprise workflows, but it’s rarely the only tool your teams use. Here’s Unito’s guide to NetSuite integration.

What Is API Integration and Why Non-Technical Teams Need to Understand It
API integration should be a building block in your tool stack, making work more seamless. Here’s how it works.

7 Feature Prioritization Frameworks That Survive Stakeholder Pressure
RICE, MoSCoW, and other prioritization frameworks are compared. Learn why priorities drift after planning sessions and how to make decisions stick.

Unito’s Guide to Getting Your Ticket Escalation Workflow Right
Ticket escalation ensures that ever issue is handled by the right person. But getting this process right can be challenging. Here’s how it’s done.

How to Standardize IT Tickets for Better Escalation
Standardizing AI tickets can create a mountain of administrative work, especially when context is scattered across multiple tools. Here’s what you can do.

The 8 Best NetSuite Competitors
NetSuite competitors allow you to get a solid ERP for less or one that supports your unique use case. Here are some of the best.